

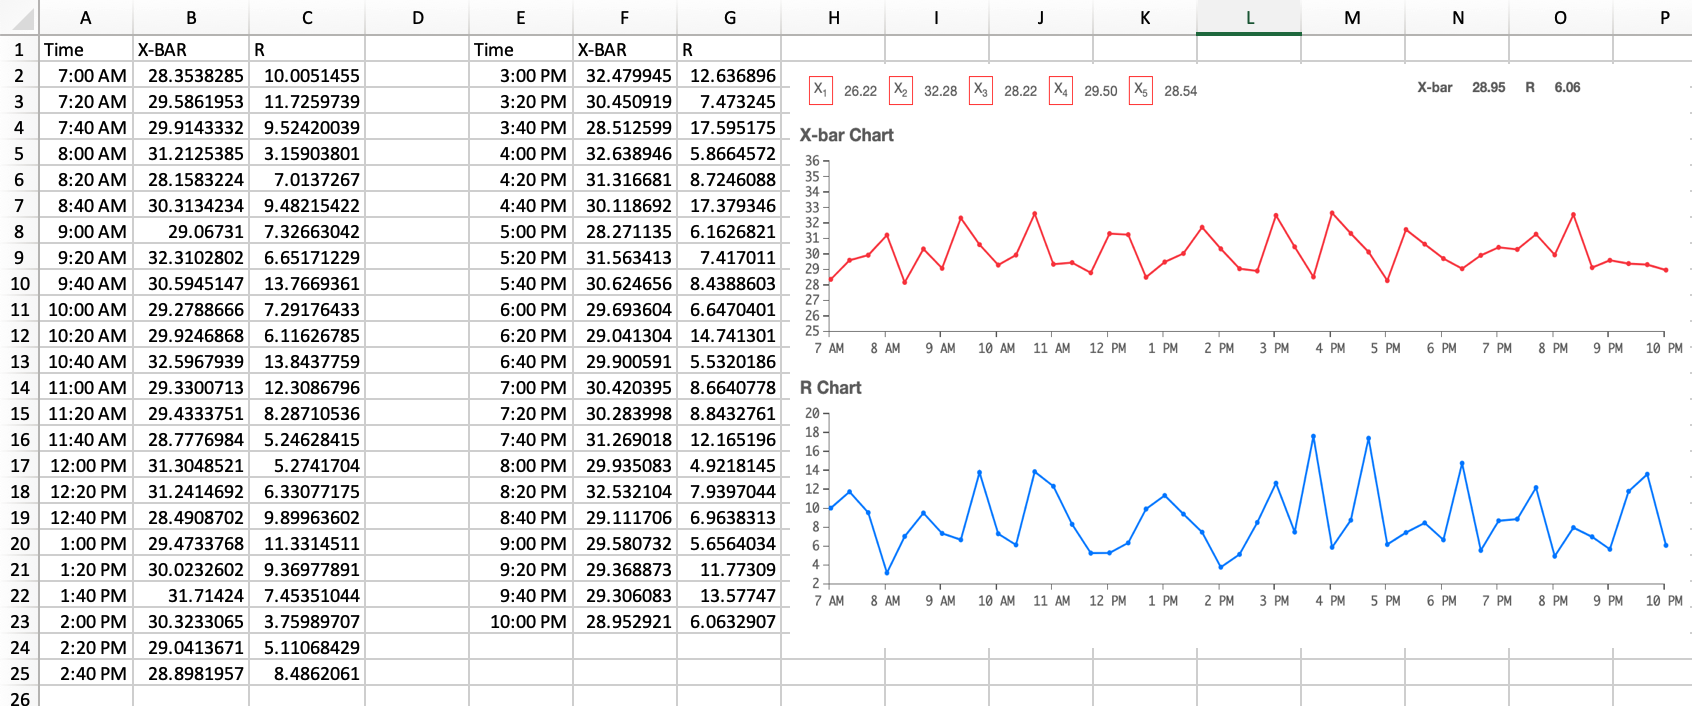
Question: How do you calculate the control limits? (Please show all work) Why do we need to use both X-bar and R charts together? Data is
- How do you calculate the control limits? (Please show all work)
- Why do we need to use both X-bar and R charts together?
Data is available via the Google drive link here: https://docs.google.com/spreadsheets/d/1nuatxqhYG4uJ5LitKNXn9bfTUkq4FDFL/edit?usp=sharing&ouid=103036333073768446383&rtpof=true&sd=true
Step by Step Solution
There are 3 Steps involved in it
1 Expert Approved Answer
Step: 1 Unlock

Question Has Been Solved by an Expert!
Get step-by-step solutions from verified subject matter experts
Step: 2 Unlock
Step: 3 Unlock