

Question: M5 Prblem Set - Quality Through Process Control Question-1 West Battery Corp produces long-life batteries and wants to use control charts to monitor battery life.The
M5 Prblem Set - Quality Through Process Control
Question-1
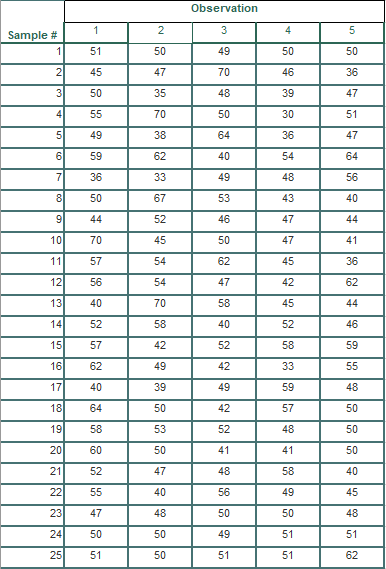
West Battery Corp produces long-life batteries and wants to use control charts to monitor battery life.The quality manager has returned from a course on statistical process control and has collected the data shown in the tab Battery Life.
a.Using this data calculate 3-Sigma control limits for X-bar and R charts.
b.Plot the sample means on the X-bar chart and the sample ranges on the R chart.
c.Do the X-bar and R charts indicate that the process is in control?Why or why not?
d.Because of rising demand a second shift has been added with some temporary workers.Six samples of battery life were taken from this shift.This data is shown in the tab Second Shift.Does this new indicate that battery life is still in control?Why or why not?Answer by plotting this new data against the control limits calculated in (a).
Table below: (Please show all calculations/formulas in Excel as this deals with sample means/ranges, control limits ,and plotting
\f
Step by Step Solution
There are 3 Steps involved in it

Get step-by-step solutions from verified subject matter experts