

Question: How do you code a scatter plott matrix from your own excel file (r or pytthon)? Example - 65 70 75 80 85 18 20
How do you code a scatter plott matrix from your own excel file (r or pytthon)?
Example -
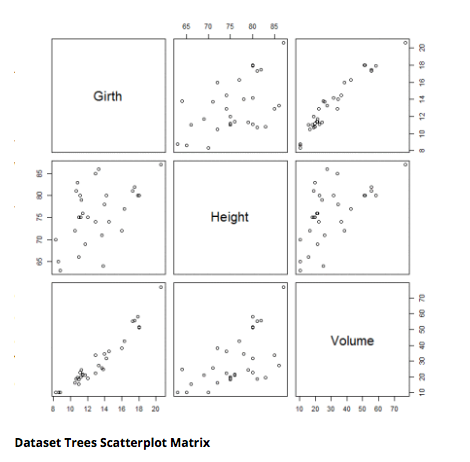
65 70 75 80 85 18 20 Girth T 8 10 12 14 16 2 80 75 Height 70 8 Volume 10 20 30 40 50 60 70 10 12 14 16 18 20 10 20 30 40 50 60 70 Dataset Trees Scatterplot Matrix
Step by Step Solution
There are 3 Steps involved in it
1 Expert Approved Answer
Step: 1 Unlock

Question Has Been Solved by an Expert!
Get step-by-step solutions from verified subject matter experts
Step: 2 Unlock
Step: 3 Unlock