

Question: YO19_Excel_Ch10_Prepare_Expansion_Analysis_PartA Project Description: Barry Cheney, the Golf Course Manager at the Red Bluff Golf Course & Pro Shop, has been considering expanding the clubhouse to
YO19_Excel_Ch10_Prepare_Expansion_Analysis_PartA
Project Description:
Barry Cheney, the Golf Course Manager at the Red Bluff Golf Course & Pro Shop, has been considering expanding the clubhouse to accommodate a steady increase in business. This expansion could include more space for the pro shop and more guest accommodations. Barry will need to provide a detailed analysis of past sales along with sales forecasts to assure William Mattingly, the resorts CEO, that the money spent on the improvements and expansion will have positive financial benefits for Red Bluff. To increase managements understanding of the current capacities, Barry has collected data about traffic, sales, and product mix. He has asked you to analyze this data, using Excels What-If Analysis tools.
Steps to Perform:
| Step | Instructions | Points Possible |
| 1 | Start Excel. Open the downloaded file named Excel_Ch10_Prepare_ExpansionAnalysis_1of2.xlsx. Grader has automatically added your last name to the beginning of the filename. | 0 |
| 2 | The Red Bluff Golf Course & Prop Shop offers golf lessons to its clients for a fee of $140.00 per lesson. The costs for each golf lesson comprises both fixed and variable costs. Conducting a break-even analysis will determine the minimum number of clients Red Bluffs needs to have signed up for golf lessons to offset the costs. On the Break-Even Analysis worksheet, in cell D6 calculate the gross revenue by multiplying the total clients by the golf lesson fee. | 3 |
| 3 | In cell D13, calculate the total fixed costs associated with providing golf lessons. | 3 |
| 4 | In cell D15, calculate the total commission the golf instructors will earn by multiplying the gross revenue by the instructor commission. | 3 |
| 5 | In cell D16, calculate the total cost of supplies by multiplying the amount of supplies per client by the total clients. | 3 |
| 6 | In cell D17, calculate the total variable costs by adding the total instructor commission and the total cost of supplies. | 3 |
| 7 | In cell D18, calculate the total expenses by adding up the total fixed costs and the total variable costs. | 3 |
| 8 | In cell D19, calculate the net income by subtracting the total expenses from the gross revenue. | 3 |
| 9 | In cell D4, conduct a simple what-if analysis by changing the value to 50, then 60, and finally 65, noticing the changes to the net income in cell D19. | 2 |
| 10 | Incorporating a scroll bar form control into the break-even analysis will make it easier to determine the number of clients necessary for Red Bluff to break even. Insert a Scroll Bar (Form Control) onto the Break-Even Analysis worksheet within the range E4:E17. Modify the Format Control properties based on the following: Current value: 65 Minimum value: 50 Maximum value: 120 Incremental change: 1 Page change: 10 Cell link: D4 | 5 |
| 11 | Conditional formatting can be used to highlight the Net Income value, in cell D19, in two different ways. One set of formatting can be applied if the net income results in a loss; another can be applied if the net income results in a profit. In cell D19, apply conditional formatting to highlight the cell to display Light Red Fill with Dark Red Text if the value is less than 0 and Green Fill with Dark Green Text if the value is greater than 0. | 6 |
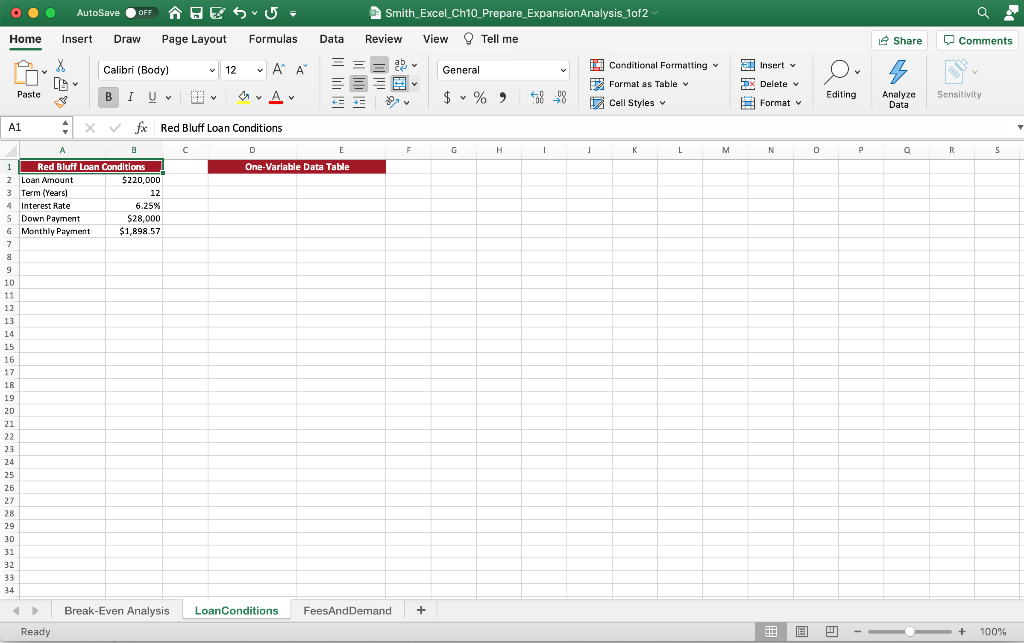
| 12 | A one-variable data table can be used to determine how much the monthly payment on a loan would be based on varying interest rates. Conditional formatting can then be applied to add emphasis and increase the readability of the monthly payment. On the LoanConditions worksheet begin to create a one-variable data table by typing various interest rates ranging from 5% through 11% in increments of 1% in cells D3:D9. | 4 |
| 13 | In cell E2, reference the cell that calculates the monthly payment amount for the loan. Apply a custom format to cell E2 so that the cell appears to be Monthly Payment. | 3 |
| 14 | Finish the one-variable data table to see the monthly payment amount for each interest rate. | 5 |
| 15 | Apply conditional formatting to the range E3:E9 using the gradient fill, green data bar option. | 4 |
| 16 | A one-variable data table can be used to determine how the changes in client demand for golf lessons will affect the expenses, revenue, and net income. You will also apply some conditional formatting to add emphasis and increase the readability of the Net Income. On the Break-Even Analysis worksheet begin to create a one-variable data table by referencing the cell that calculates the total expenses in cell H4. In cell I4, reference the cell that calculates the gross revenue. In cell J4, reference the cell that calculates the net income. | 6 |
| 17 | Apply custom formatting to cells H4:J4 so that the results of the referenced cells are hidden. | 5 |
| 18 | Finish the one-variable data table to see how the expenses, revenue, and net income change when the total number of clients vary from 10 to 100. | 5 |
| 19 | Apply conditional formatting to the range J5:J14 to highlight cells with a light red fill with dark red text if the value is less than 0 and apply a green fill with dark green text formatting if the values are greater than 2000. | 6 |
| 20 | A traditional cost-volume-profit chart based on the one-variable data table will further help in analyzing the break-even point for golf lesson pricing. Create a 2-D Line chart using the data in cells G3:I3 and G5:I14. Position the chart so that the top left corner is inside the border of cell F16. Add a primary horizontal axis title with the text Client Demand. Include a chart title of Cost-Volume-Profit. | 10 |
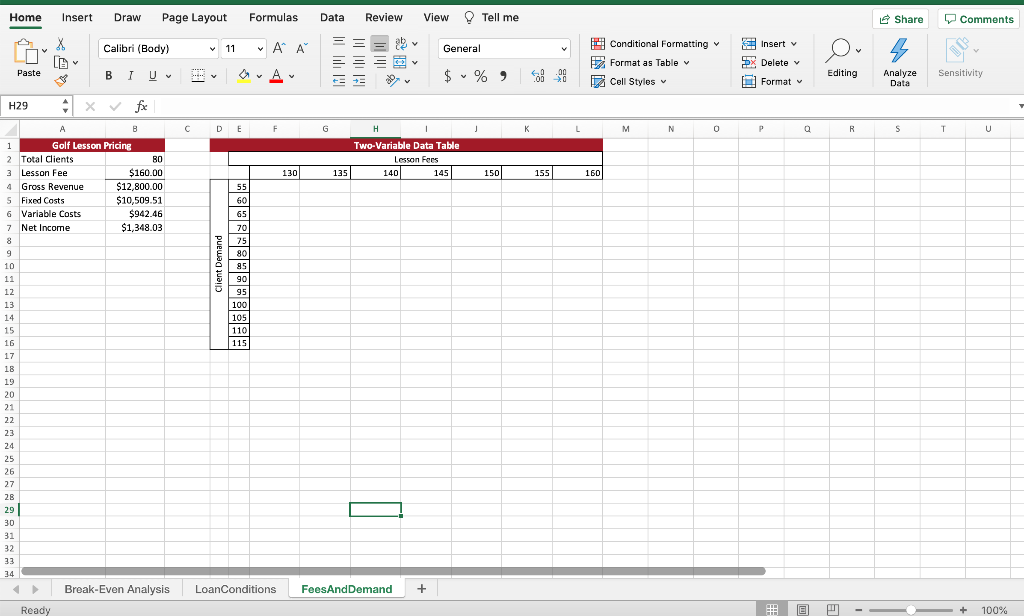
| 21 | A two-variable data table that calculates revenue can help in the analysis of various client demand and lesson fee scenarios. On the FeesAndDemand worksheet, begin to create a two-variable data table by referencing the cell that calculates net income in cell E3. | 3 |
| 22 | Apply a custom format to cell E3 so that the formula result of the referenced cell is hidden. | 4 |
| 23 | Finish the two-variable data table to see how the net income changes when lesson fees and client demand vary. | 5 |
| 24 | Conditional formatting will add emphasis and increase the readability of the data table. Format the cells F4:L16 as Currency. Apply conditional formatting to the range to highlight cells with a light red fill with dark red text if the value is less than 0 and apply a green fill with dark green text formatting if the values are greater than 3500. | 6 |
| 25 | Save and close Excel_Ch10_Prepare_ExpansionAnalysis_1of2. Exit Excel. Submit your files as directed. Please note: This project continues in part B, which can be found in the Product Shared Library. | 0 |
| Total Points | 100 |
I need help doing this in Excel please!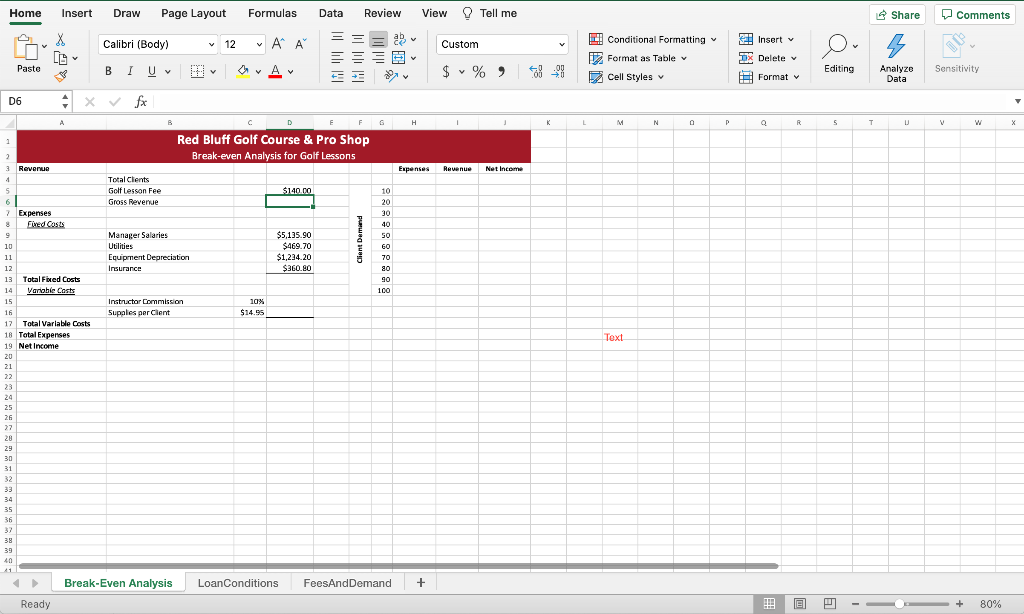
Home Insert Draw Page Layout Formulas Data Review View Tell me Share Comments Calibri (Body) == 12 ab . A A A X [L Custom Conditional Formatting Insert TX Delete Y y 112 Format as Table Paste B I U CA Av $ v % %) 68-98 Editing Sensitivity Cell Styles Analyze Data Format D6 A F G H L M N N P Q R 5 T T U w X 1 Red Bluff Golf Course & Pro Shop Break-even Analysis for Golf Lessons 2 Revenue Expenses Revenue Net Income 4 5 Total Clents Golflesson Fee Gross Revenue $140.00 10 20 30 Manager Salaries Utilities Equipment Depreciation Insurance $5,135.90 $469.70 $1,234,20 $360.80 Client Demand 40 50 60 70 80 90 100 7 Expenses 8 Fred Costs 9 10 11 12 13 Total Fibed Costs Variable Cast: 15 16 17 Total Variable costs 18 Total Expenses 19 Net Income 20 21 22 Instructor Commission Supales per Clent 10% $14.95 Text 24 25 26 27 28 29 30 31 33 34 35 36 38 39 40 41 Break-Even Analysis LoanConditions FeesAndDemand + Ready !!! + 80% AutoSave OFF HE SU Smith_Excel_Ch10_Prepare_Expansion Analysis_1of2 Home Insert Draw Page Layout Formulas Data Review View Tell me e Share Comments Calibri (Body) v 12 - AP A General Conditional Formatting 2 Format as Table Cell Styles Insert DX Delete 5 Paste B 1 Uv ar Av $ % ) 68_98 Editing Sensitivity Format Analyze Data A1 . fx Red Bluff Loan Conditions A C D E F H 1 L M N o P R 5 One-Variable Data Table 1 Red Bluff Loan Conditions 2 Loan Amount $220,000 3 Term (Years! 12 4 Interest Rate 6.25% 5 Down Payment $28,000 6 Monthly Payment $1,898.57 7 8 9 10 11 12 13 14 15 16 17 18 19 20 21 22 23 24 25 26 27 28 29 30 31 32 33 34 Break-Even Analysis LoanConditions FeesAndDemand + + Ready 100% Home Insert Draw Page Layout Formulas Data Review View Tell me Share Comments Calibri (Body) 11 A ab y General Insert v Conditional Formatting Format as Table 5X Delete v Paste B 1 $ % % Editing Sensitivity 20 Cell Styles Analyze Data Format H29 X fx B DL F G H L M N 0 P Q R S T T U Two-Variable Data Table Lesson Fees 140 145 130 135 150 155 160 55 60 65 70 75 80 85 90 95 100 105 110 115 1 Golf Lesson Pricing 2 Total Clients BO 3 Lesson Fee $160.00 4 Gross Revenue $12,800.00 5 Fixed Costs $10,509.51 6 Variable Costs $942.46 7 Net Income $1,348.03 8 9 10 11 12 13 14 15 16 17 18 19 20 21 22 23 24 25 26 27 28 29 30 31 32 33 34 I Break Even Analysis LoanConditions FeesAnd Demand + Ready + 100% Home Insert Draw Page Layout Formulas Data Review View Tell me Share Comments Calibri (Body) == 12 ab . A A A X [L Custom Conditional Formatting Insert TX Delete Y y 112 Format as Table Paste B I U CA Av $ v % %) 68-98 Editing Sensitivity Cell Styles Analyze Data Format D6 A F G H L M N N P Q R 5 T T U w X 1 Red Bluff Golf Course & Pro Shop Break-even Analysis for Golf Lessons 2 Revenue Expenses Revenue Net Income 4 5 Total Clents Golflesson Fee Gross Revenue $140.00 10 20 30 Manager Salaries Utilities Equipment Depreciation Insurance $5,135.90 $469.70 $1,234,20 $360.80 Client Demand 40 50 60 70 80 90 100 7 Expenses 8 Fred Costs 9 10 11 12 13 Total Fibed Costs Variable Cast: 15 16 17 Total Variable costs 18 Total Expenses 19 Net Income 20 21 22 Instructor Commission Supales per Clent 10% $14.95 Text 24 25 26 27 28 29 30 31 33 34 35 36 38 39 40 41 Break-Even Analysis LoanConditions FeesAndDemand + Ready !!! + 80% AutoSave OFF HE SU Smith_Excel_Ch10_Prepare_Expansion Analysis_1of2 Home Insert Draw Page Layout Formulas Data Review View Tell me e Share Comments Calibri (Body) v 12 - AP A General Conditional Formatting 2 Format as Table Cell Styles Insert DX Delete 5 Paste B 1 Uv ar Av $ % ) 68_98 Editing Sensitivity Format Analyze Data A1 . fx Red Bluff Loan Conditions A C D E F H 1 L M N o P R 5 One-Variable Data Table 1 Red Bluff Loan Conditions 2 Loan Amount $220,000 3 Term (Years! 12 4 Interest Rate 6.25% 5 Down Payment $28,000 6 Monthly Payment $1,898.57 7 8 9 10 11 12 13 14 15 16 17 18 19 20 21 22 23 24 25 26 27 28 29 30 31 32 33 34 Break-Even Analysis LoanConditions FeesAndDemand + + Ready 100% Home Insert Draw Page Layout Formulas Data Review View Tell me Share Comments Calibri (Body) 11 A ab y General Insert v Conditional Formatting Format as Table 5X Delete v Paste B 1 $ % % Editing Sensitivity 20 Cell Styles Analyze Data Format H29 X fx B DL F G H L M N 0 P Q R S T T U Two-Variable Data Table Lesson Fees 140 145 130 135 150 155 160 55 60 65 70 75 80 85 90 95 100 105 110 115 1 Golf Lesson Pricing 2 Total Clients BO 3 Lesson Fee $160.00 4 Gross Revenue $12,800.00 5 Fixed Costs $10,509.51 6 Variable Costs $942.46 7 Net Income $1,348.03 8 9 10 11 12 13 14 15 16 17 18 19 20 21 22 23 24 25 26 27 28 29 30 31 32 33 34 I Break Even Analysis LoanConditions FeesAnd Demand + Ready + 100%
Step by Step Solution
There are 3 Steps involved in it

Get step-by-step solutions from verified subject matter experts