

Question: How do you determine what a new graph would look like if you're not given any values besides a new sample size?Here they're asking what
How do you determine what a new graph would look like if you're not given any values besides a new sample size?Here they're asking what the shape would be based on a sample of 10,000.What if the sample size was only 200?
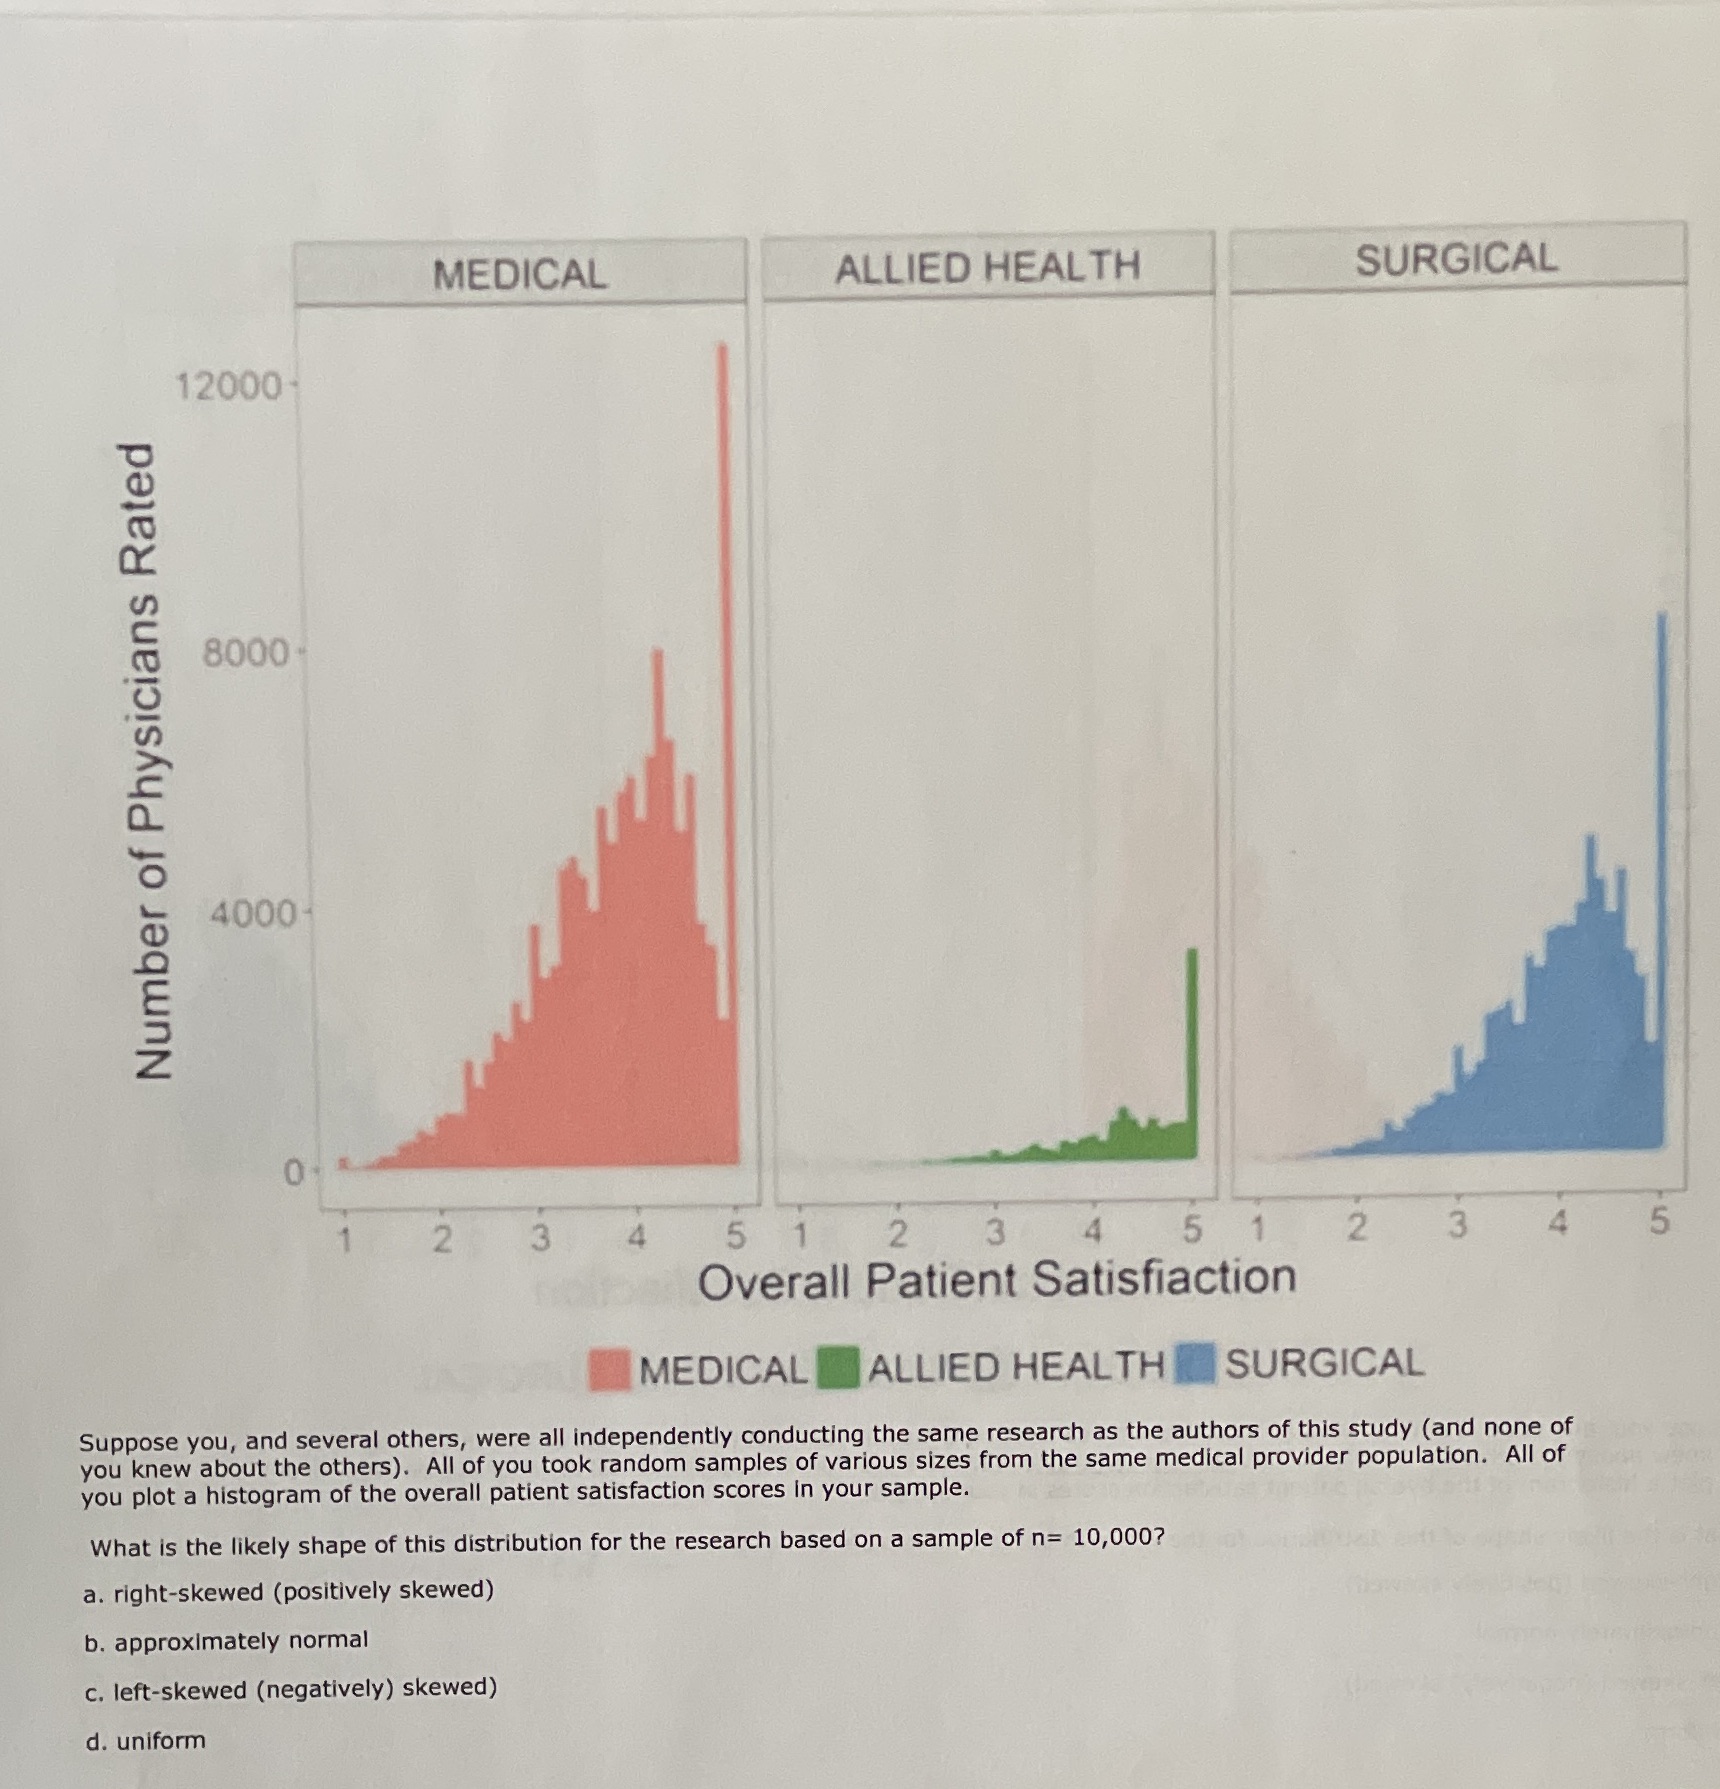
MEDICAL ALLIED HEALTH SURGICAL 12000 8000 Number of Physicians Rated 4000- 2 3 4 5 2 3 4 5 1 2 3 4 5 Overall Patient Satisfaction MEDICAL ALLIED HEALTH SURGICAL Suppose you, and several others, were all independently conducting the same research as the authors of this study (and none of you knew about the others). All of you took random samples of various sizes from the same medical provider population. All of you plot a histogram of the overall patient satisfaction scores in your sample. What is the likely shape of this distribution for the research based on a sample of n= 10,000? a. right-skewed (positively skewed) b. approximately normal c. left-skewed (negatively) skewed) d. uniform
Step by Step Solution
There are 3 Steps involved in it

Get step-by-step solutions from verified subject matter experts