

Question: how do you do Match the regression equation with the appropriate graph. Drag each graph given below to its corresponding regression equation to the right.
how do you do
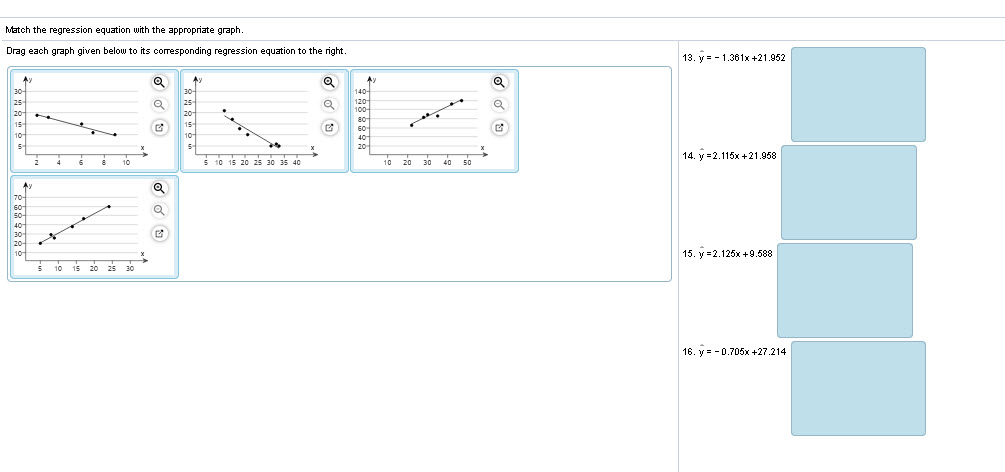
Match the regression equation with the appropriate graph. Drag each graph given below to its corresponding regression equation to the right. 13. y = - 1.361x +21.952 30 30 140 25 120 100- 20 80- 15 60 in a 10 40 X 14. y =2.115x +21.958 2 4 10 5 10 15 20 25 30 35 40 10 20 30 50 70 40 15. y =2.125x +9.588 10 15 20 25 30 16. y = - D.705x +27.214
Step by Step Solution
There are 3 Steps involved in it
1 Expert Approved Answer
Step: 1 Unlock

Question Has Been Solved by an Expert!
Get step-by-step solutions from verified subject matter experts
Step: 2 Unlock
Step: 3 Unlock