

Question: Match the regression equation with the appropriate graph. Drag each graph given below to its corresponding regression equation to the right. 140 120- 70- 13.
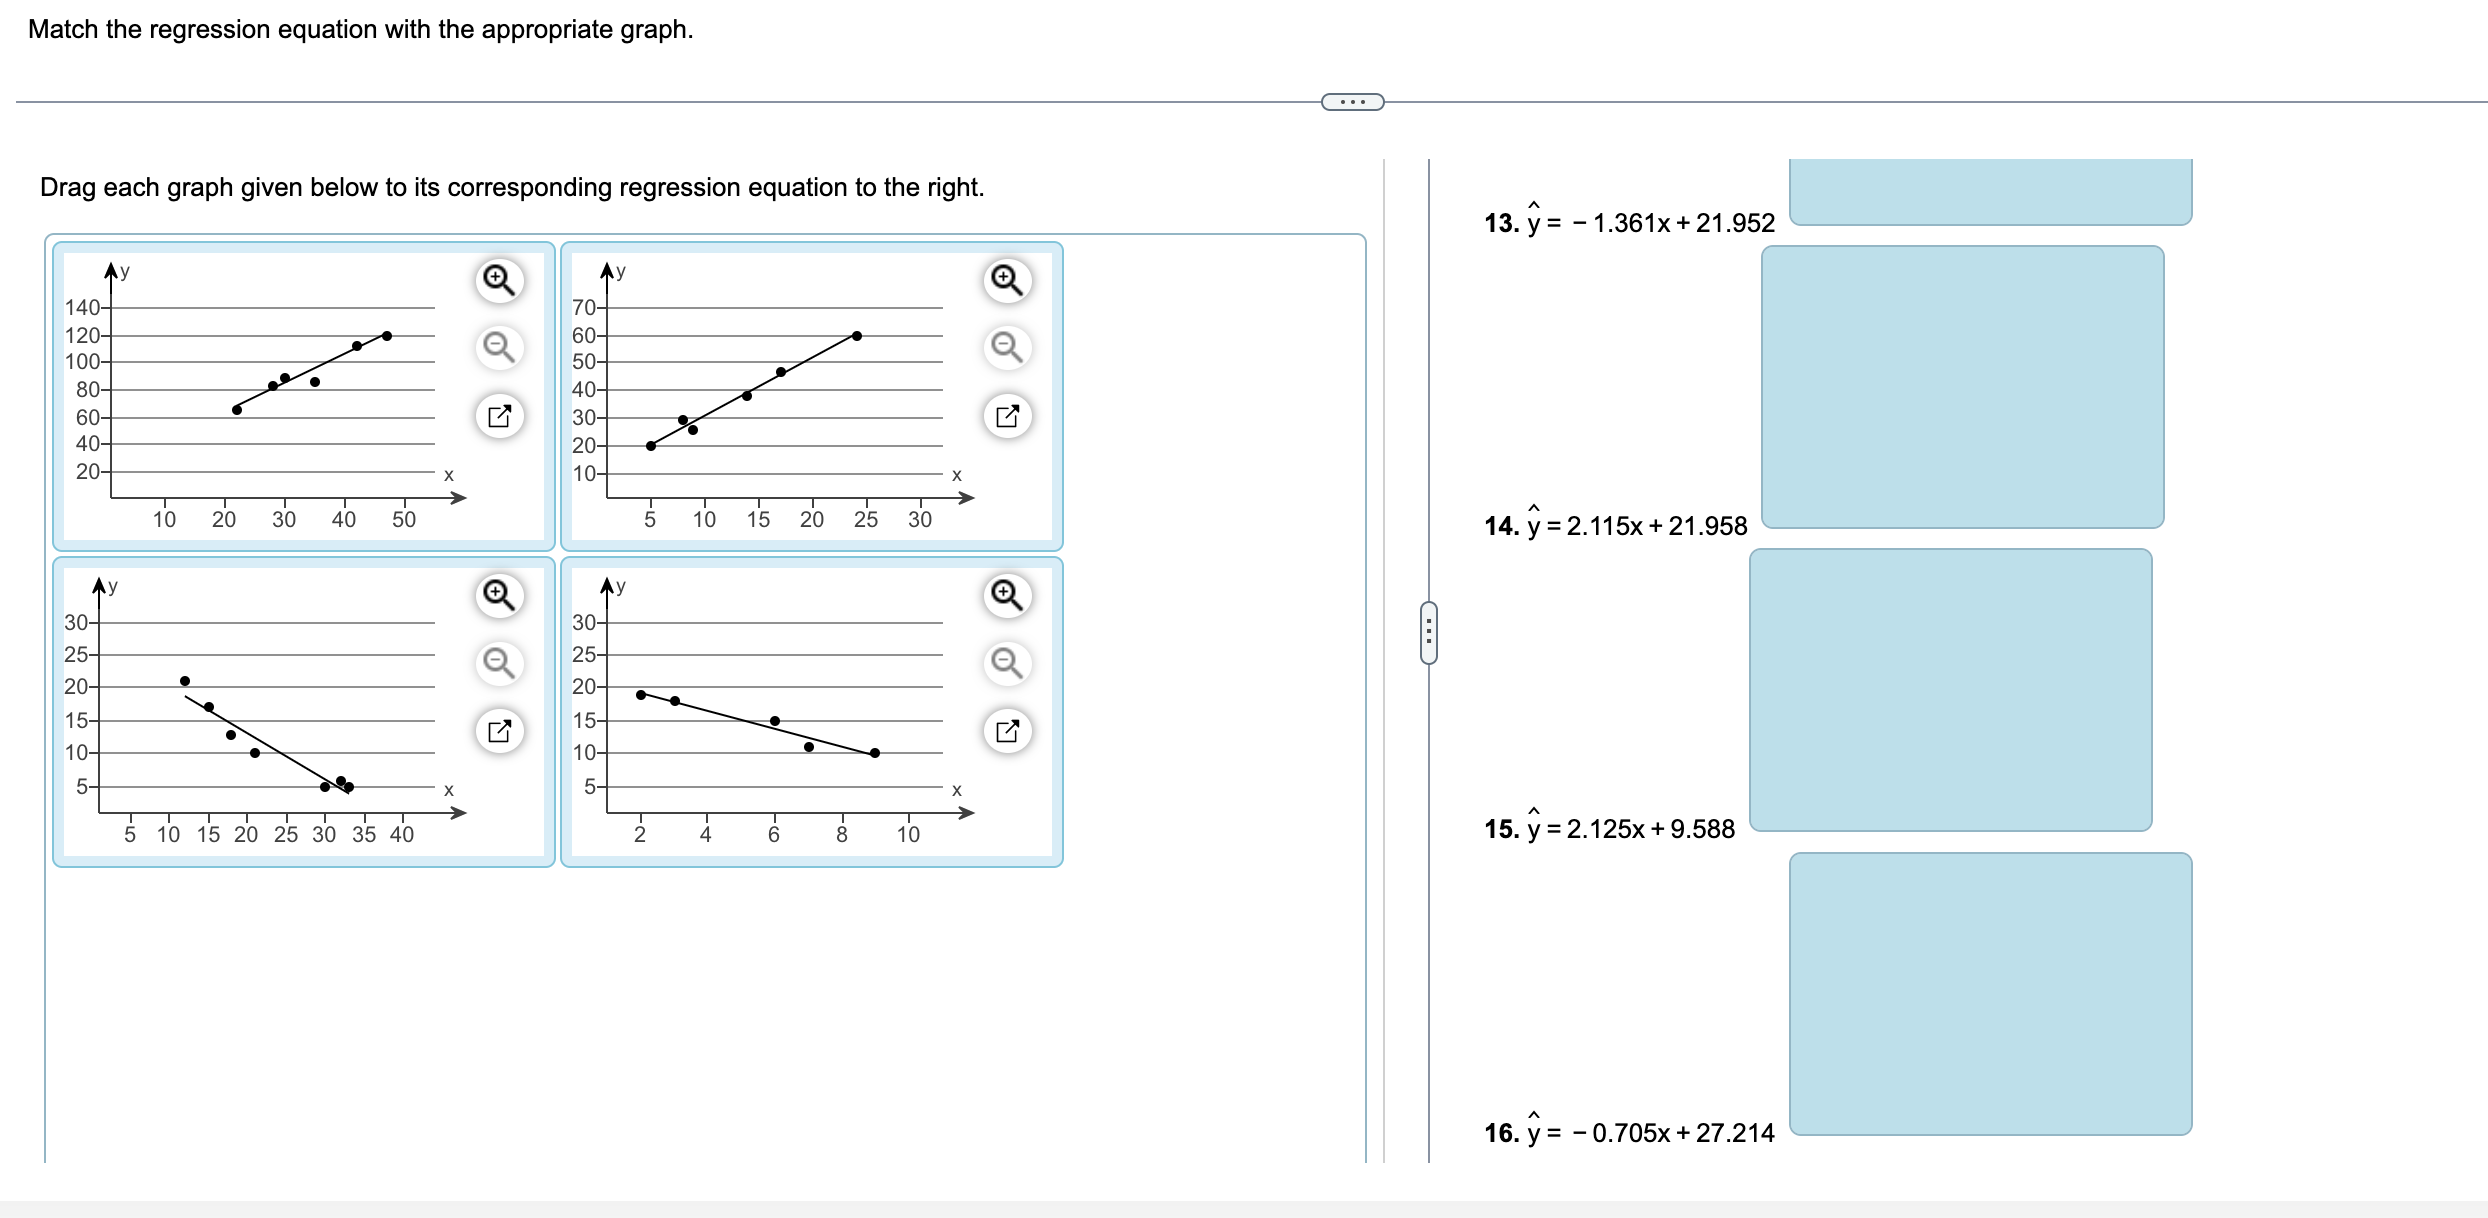
Match the regression equation with the appropriate graph. Drag each graph given below to its corresponding regression equation to the right. 140 120- 70- 13. y= - 1.361x + 21.952 100- 60- 80- 50- 60- 40- 40- 30- 20- 20- 10 10 20 30 40 50 5 10 15 20 25 30 Ay 30- Ay 14. y = 2.115x + 21.958 25- 30- 20- 25- 15- 20- 10- 15 5 - 10 X 5. 5 10 15 20 25 30 35 40 6 8 10 15. y = 2.125x + 9.588 16. y= - 0.705x + 27.214
Step by Step Solution
There are 3 Steps involved in it
1 Expert Approved Answer
Step: 1 Unlock

Question Has Been Solved by an Expert!
Get step-by-step solutions from verified subject matter experts
Step: 2 Unlock
Step: 3 Unlock