

Question: How do you do this problem? I can get the right answer! Thanks! You are asked to perform a scenario analysis instead of a sensitivity
How do you do this problem? I can get the right answer! Thanks!
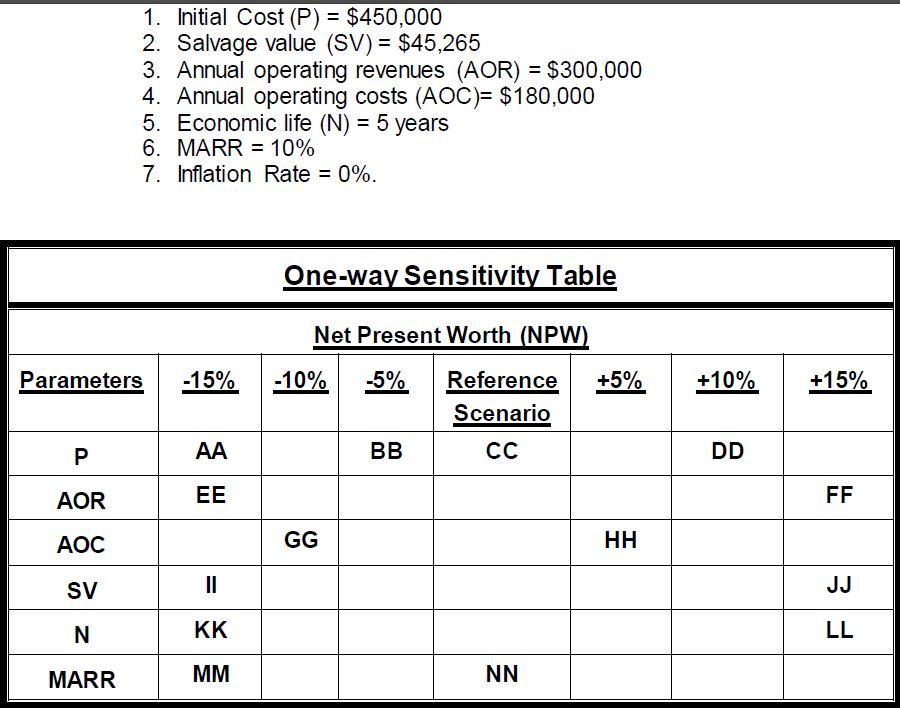
You are asked to perform a scenario analysis instead of a sensitivity analysis. Assume that the values of the three scenarios (optimistic, most likely and pessimistic) are to be populated from NPW values from the sensitivity tables shown above. The dollar value of the projects life (duration) for the optimistic scenario would be a) 5 years; b) 1.15(5) years; c) 0.85(5) years; d) 0 years.
I. Initial Cost (P) = $450,000 2. Salvage value (SV)= $45,265 3. Annual operating revenues (AOR) = $300,000 4. Annual operating costs (AOC)= $180,000 5. Economic life (N) = 5 years 6. MARR= 10% 7. Inflation Rate=0% One-way Sensitivity Table Net Present Worth (NPW Parameters -15% -10%| -5% | Reference l +5% +10% +15% Scenario AOR AOC SV MARR
Step by Step Solution
There are 3 Steps involved in it

Get step-by-step solutions from verified subject matter experts