

Question: how do you graph this in desmos 33. Use the data provided to graphically determine the order and rate constant of the following reaction SO,Cl,
how do you graph this in desmos 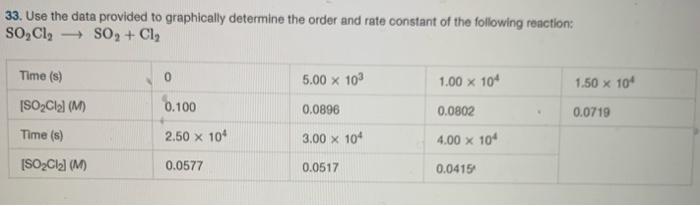
33. Use the data provided to graphically determine the order and rate constant of the following reaction SO,Cl, - SO, + Cl, Time (s) 0 5.00 x 10 1.00 x 10+ 1.50 x 10 [SO2Cl2] (M) 0.100 0.0896 0.0802 0.0719 Time (s) 2.50 X 100 3.00 x 10⁴ 4.00 x 10⁴ [SO2Cl2 (M) 0.0577 0.0517 0.0415
Step by Step Solution
There are 3 Steps involved in it
1 Expert Approved Answer
Step: 1 Unlock

Question Has Been Solved by an Expert!
Get step-by-step solutions from verified subject matter experts
Step: 2 Unlock
Step: 3 Unlock