

Question: how do you make graph? .5 The following graph shows the market for apples. Assume that the government has imposed a price floor of $10
how do you make graph?
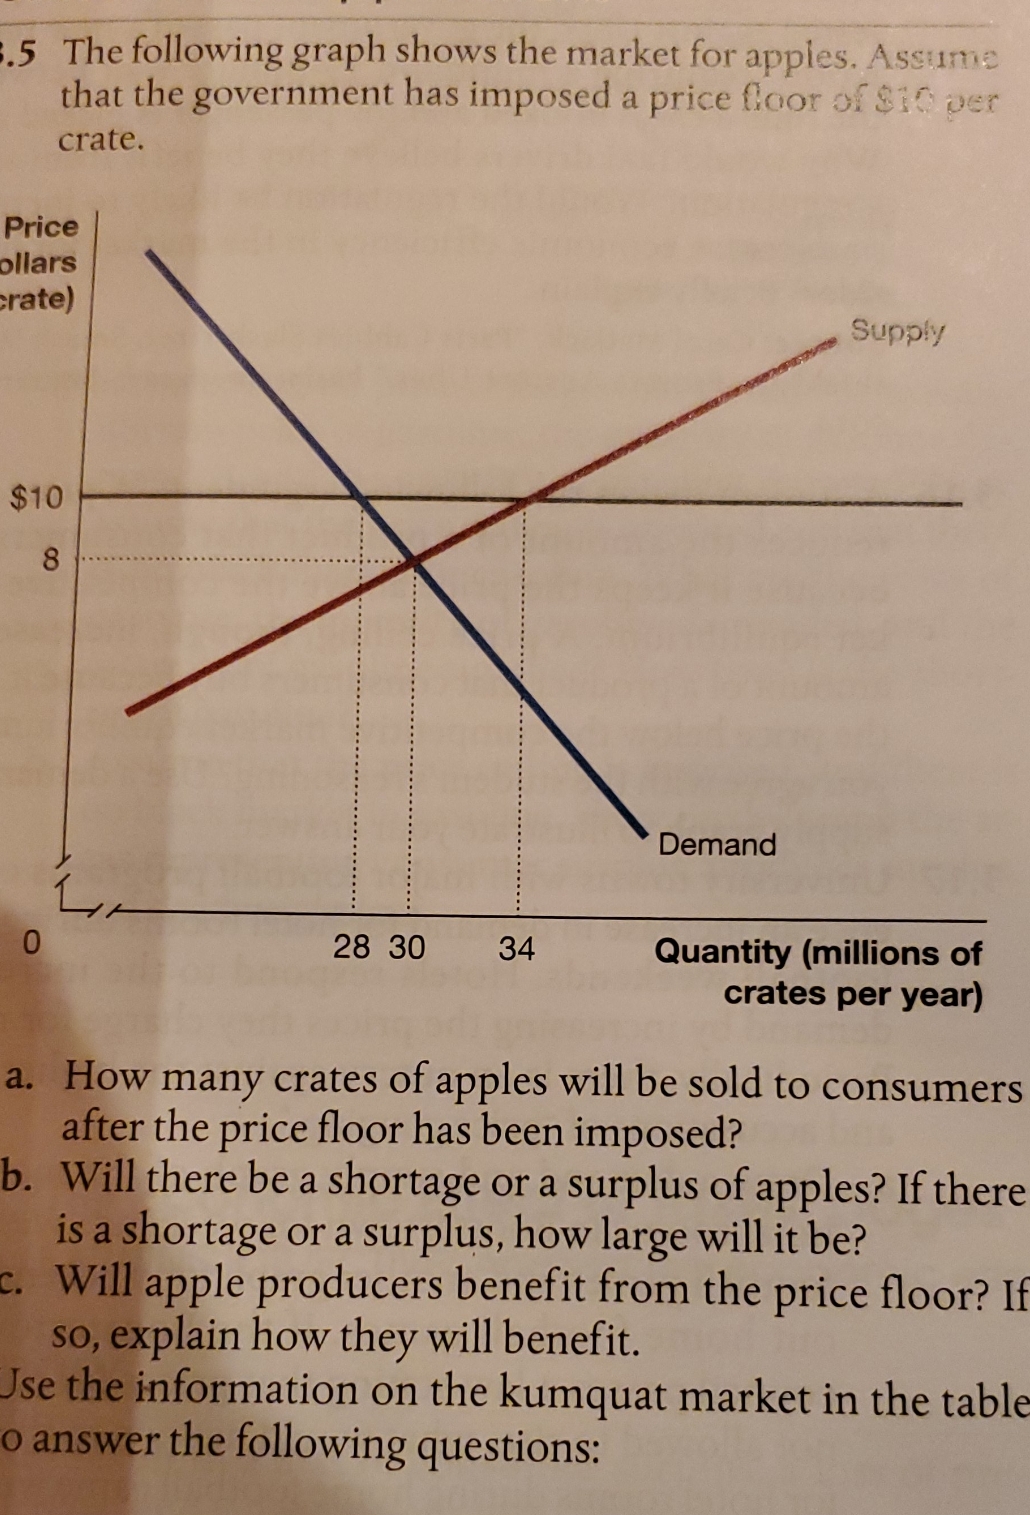
.5 The following graph shows the market for apples. Assume that the government has imposed a price floor of $10 per crate. Price ollars rate) Supply $10 8 Demand 28 30 34 Quantity (millions of crates per year) a. How many crates of apples will be sold to consumers after the price floor has been imposed? b. Will there be a shortage or a surplus of apples? If there is a shortage or a surplus, how large will it be? c. Will apple producers benefit from the price floor? If so, explain how they will benefit. Use the information on the kumquat market in the table o answer the following questions
Step by Step Solution
There are 3 Steps involved in it
1 Expert Approved Answer
Step: 1 Unlock

Question Has Been Solved by an Expert!
Get step-by-step solutions from verified subject matter experts
Step: 2 Unlock
Step: 3 Unlock