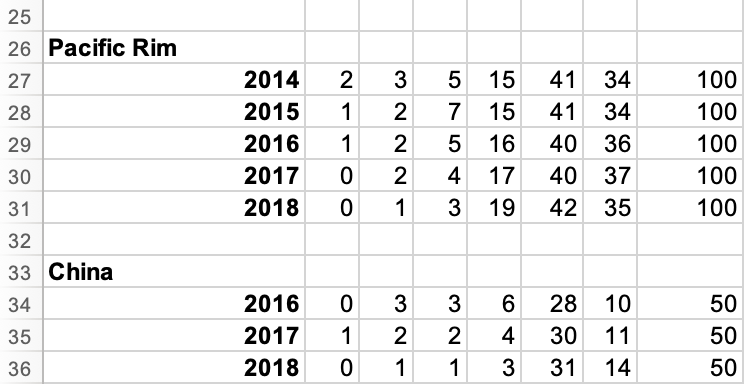
Question: How do you organize this data to make a pivot table by score & market? Do you retype the info in a different way, then

How do you organize this data to make a pivot table by score & market? Do you retype the info in a different way, then select something, then insert a pivot table or do you just select something already in the doc and insert a pivot table? Please help!How do you organize this data to make a pivotHow do you organize this data to make a pivot

B C D E F G A 1 End-User Satisfaction Sample 3 3 5 Size 4 Survey Scale: 2 5 North America 6 15 2014 1 3 37 38 100 2015 1 2 4 18 35 40 100 2016 1 2 17 34 41 100 2017 100 4 15 33 46 15 31 49 100 2018 11 12 South America 2014 1 36 38 100 5 18 13 6 17 6 19 2015 36 37 100 14 2016 37 36 100 15 2017 5 20 37 36 100 16 2018 2 5 19 37 37 100 17 18 19 Europe 2014 2 4 21 36 36 100 20 2015 1 34 37 100 5 21 21 2016 4 26 37 31 100 22 2017 17 41 37 100 23 2018 19 45 33 100 24 25 26 Pacific Rim 2014 3 15 34 100 27 2015 2 15 34 100 28 2016 2 16 36 100 40 29 2017 2 4 17 40 37 100 30 2018 3 19 42 35 100 31 32 33 China 2016 28 10 50 34 2017 4 30 11 50 35 2018 1 3 31 14 50 36 LO LO

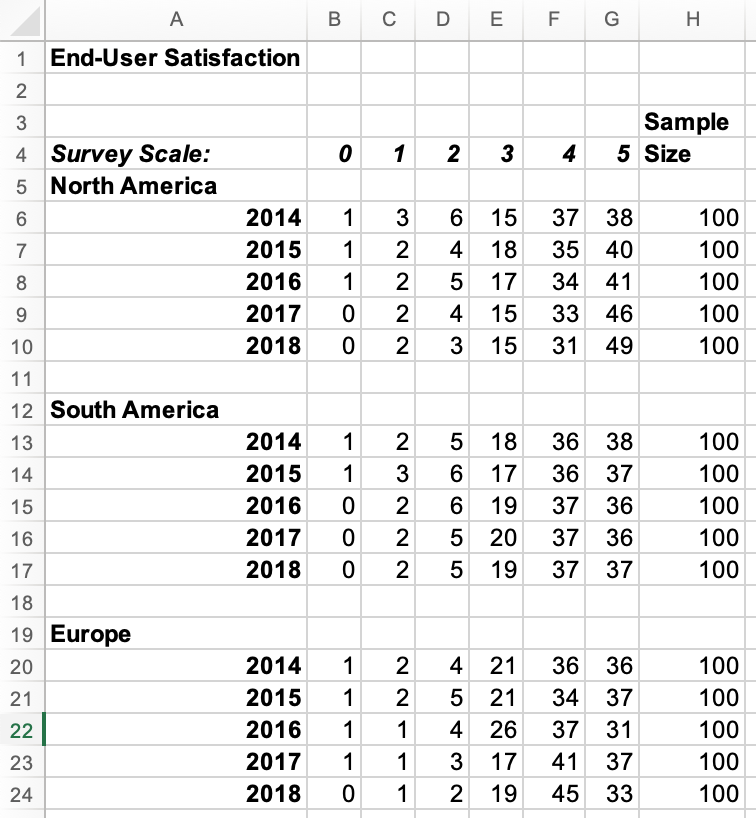
Step by Step Solution

There are 3 Steps involved in it

1 Expert Approved Answer
Step: 1 Unlock blur-text-image
Question Has Been Solved by an Expert!

Get step-by-step solutions from verified subject matter experts

Step: 2 Unlock
Step: 3 Unlock

Students Have Also Explored These Related General Management Questions!