

Question: how do you plot a time series graph using matplotlib in python with data in the form of 3d numpy arrays? the code below produces
how do you plot a time series graph using matplotlib in python with data in the form of 3d numpy arrays?
the code below produces an error.
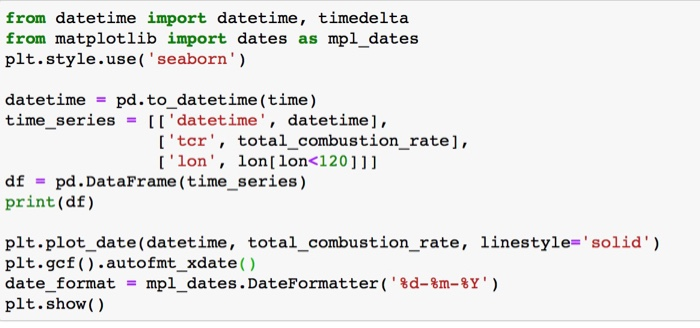
from datetime import datetime, timedelta from matplotlib import dates as mpl_dates plt.style.use('seaborn') datetime = pd.to_datetime (time) time series = [['datetime', datetime], ['tcr', total_combustion_rate], ['lon, lon[lon
Step by Step Solution
There are 3 Steps involved in it
1 Expert Approved Answer
Step: 1 Unlock

Question Has Been Solved by an Expert!
Get step-by-step solutions from verified subject matter experts
Step: 2 Unlock
Step: 3 Unlock