

Question: how do you plot the data given to find coloumbs constant? n coulomb's constai x [Solved] Use measurements to d x + u=2592859&isprv=&drc=0&qi=536473&cfql=0&dnb=0&fromQB=0 Module 3
how do you plot the data given to find coloumbs constant?
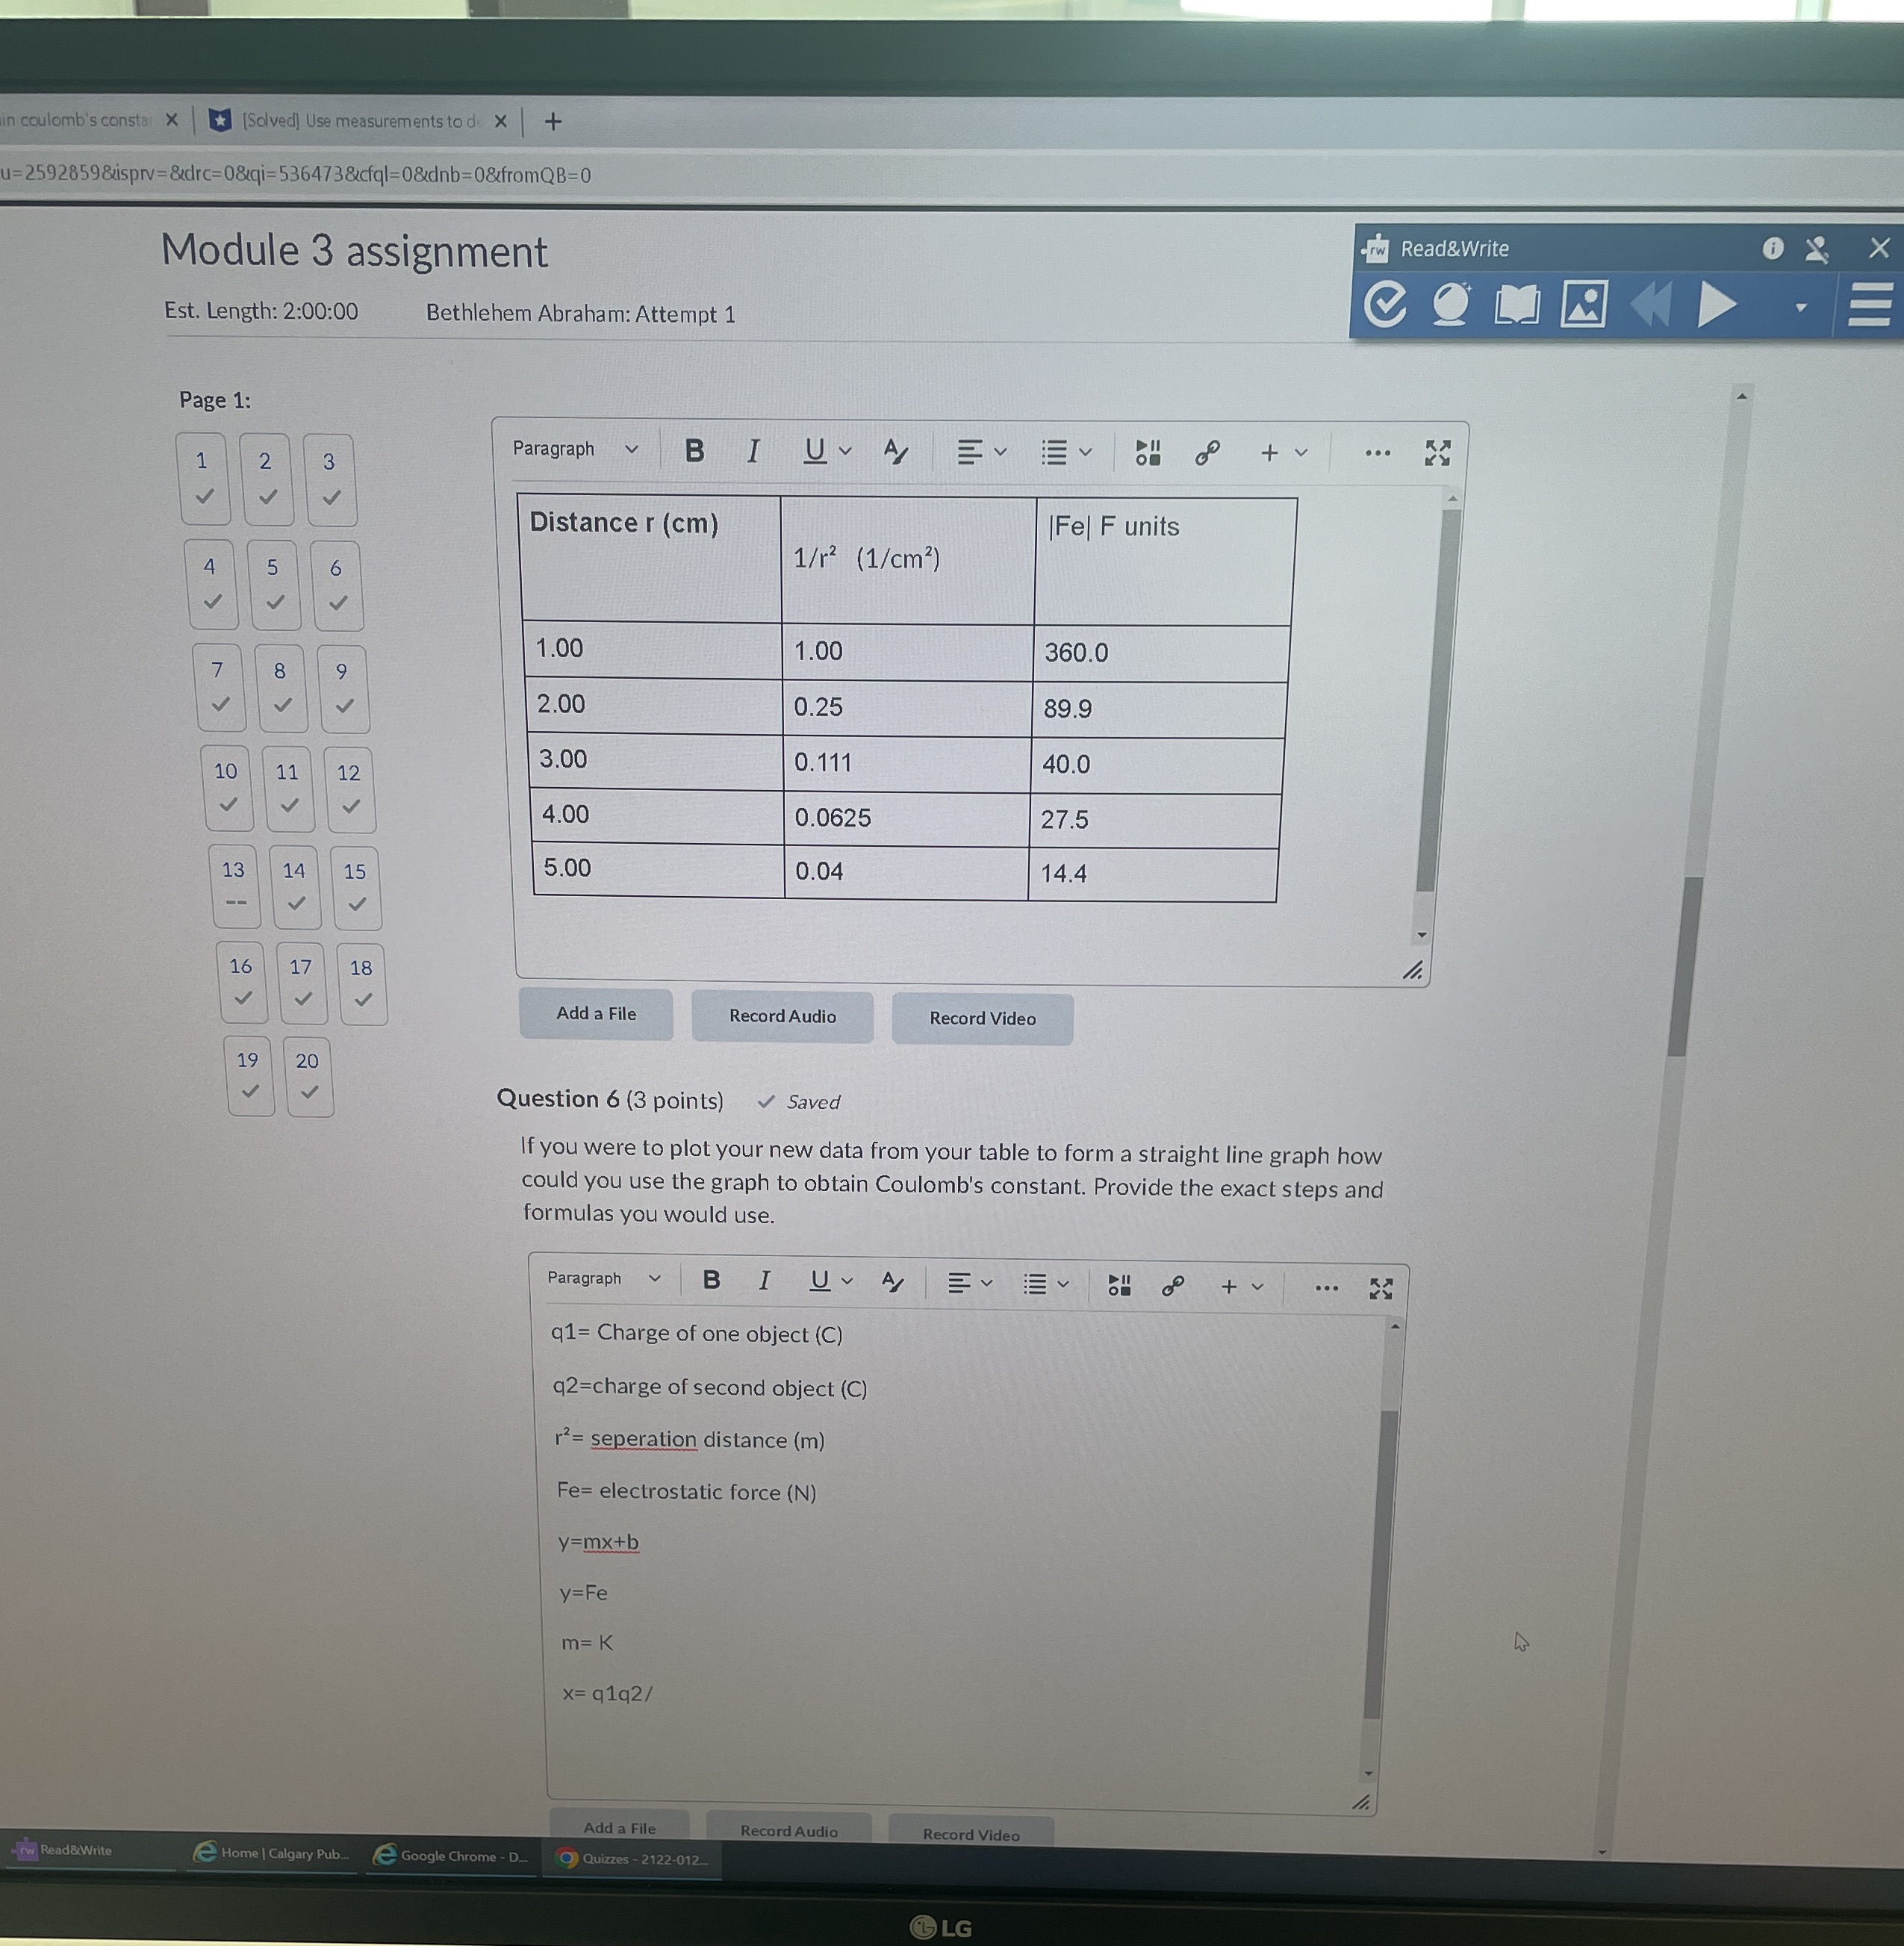
n coulomb's constai x [Solved] Use measurements to d x + u=2592859&isprv=&drc=0&qi=536473&cfql=0&dnb=0&fromQB=0 Module 3 assignment rw Read&Write O X X Est. Length: 2:00:00 Bethlehem Abraham: Attempt 1 Page 1: Paragraph BIUA EV + v ... Distance r (cm) Fel F units 5 1/r2 (1/cm?) 1.00 1.00 360.0 7 8 9 V 2.00 0.25 89.9 3.00 0.111 40.0 10 11 12 V 4.00 0.0625 27.5 14 5.00 0.04 14.4 V 17 18 Add a File Record Audio Record Video 19 20 Question 6 (3 points) Saved If you were to plot your new data from your table to form a straight line graph how could you use the graph to obtain Coulomb's constant. Provide the exact steps and formulas you would use. Paragraph B I UA E E 6: + v ... q1= Charge of one object (C) q2=charge of second object (C) r2= seperation distance (m) Fe= electrostatic force (N) y=mx+b y=Fe m = K x= q1q2/ Add a File Record Audio Record Video -rw Read &Write @Home | Calgary Pub. Google Chrome - D. ) Quizzes - 2122-012 LG
Step by Step Solution
There are 3 Steps involved in it

Get step-by-step solutions from verified subject matter experts