

Question: How does debt add value to CPK? fill the table. 2. How does debt add value to CPK? a. Add the following values to the
- How does debt add value to CPK? fill the table.
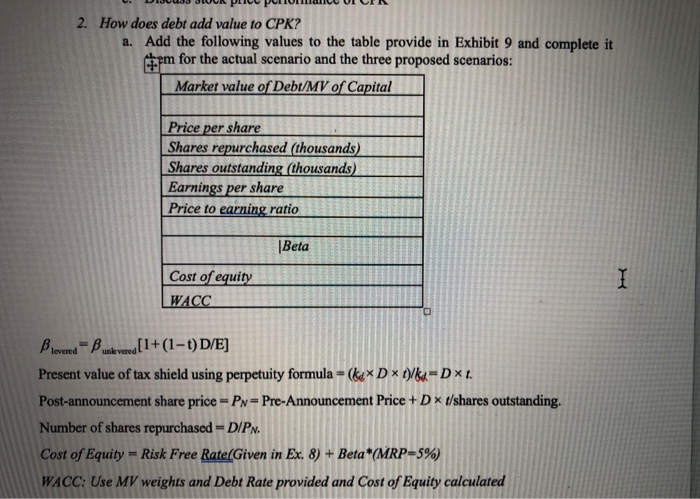
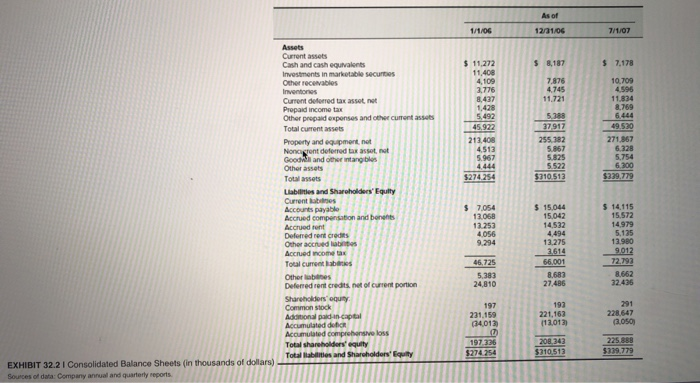
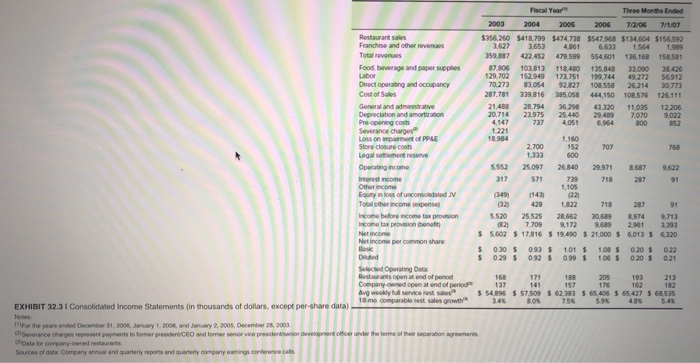
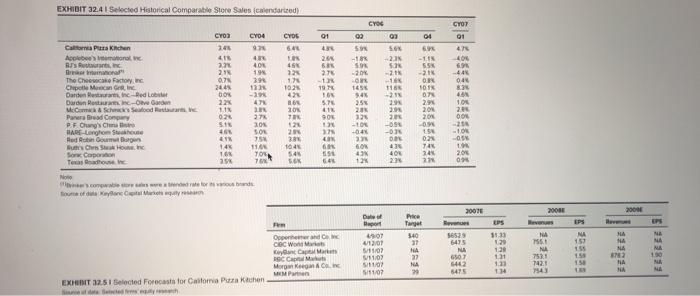
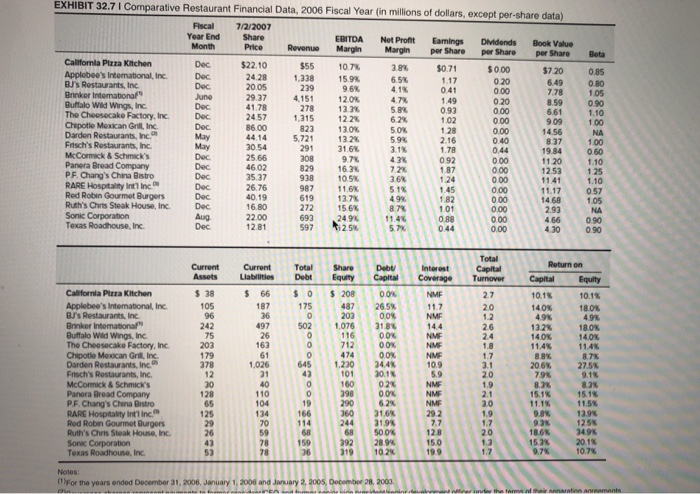
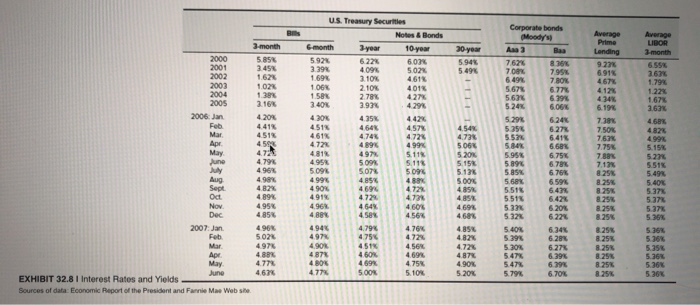
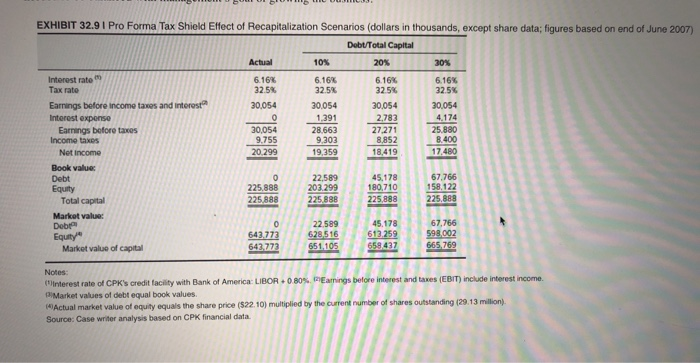
2. How does debt add value to CPK? a. Add the following values to the table provide in Exhibit 9 and complete it pm for the actual scenario and the three proposed scenarios: Market value of Debt/MV of Capital Price per share Shares repurchased (thousands) Shares outstanding (thousands) Earnings per share Price to earning ratio Beta Cost of equity I WACC unk vered Present value of tax shield using perpetuity formula (kex Dx t)/ka=Dxt. Post-announcement share price= PN=Pre-Announcement Price + Dx t/shares outstanding. Number of shares repurchased = DIPN. Cost of Equity Risk Free Rate(Given in Ex. 8)+ Beta*(MRP=5%) WACC: Use MV weights and Debt Rate provided and Cost of Equity calculated As of 1/1/06 12/31/06 7/1/07 Assets Current assets Cash and cash equvalents Investments in marketable securties Other recevables Inventones Current deferred tax asset, not Propaid income tax Other prepaid expenses and other curent assets $ 7,178 s 8,187 $ 11,272 11,408 4,109 3,776 8437 1,428 5,492 45.922 7876 4.745 11,721 10,709 4.596 11.834 8.769 5.388 6.444 37,917 49.530 Total current assets 271867 6.328 5,754 6.300 213408 4513 5.967 4444 $274.254 255,382 5867 5.825 5.522 Property and equpment, not Noncgront deferred tax assot, not Good and other intangbles Other assets $310.513 $339,779 Total assets Labilities and Sharoholders Equity Current kabdines Accounts payable Accrued compensation and bonehts $ 7,054 13.068 S 14.115 15572 S15.044 15,042 14.532 4494 13.275 3614 14.979 5,135 13.980 9,012 13.253 4.056 9294 Accrued rent Defered rent credts Other accrued labntes Accrued ncote tax 72.793 66.001 46,725 Total curment habes 8.683 27,486 8,662 32436 5.383 24.810 Other labes Defemed rent credits net of curent porticn Shareholders oquty Common stock 291 228.647 (3.050) 193 221,163 197 231.159 04.013 (h 197.336 Additonal paidan-captal Accumulated defict Accumulated comprehonsive loss Total shareholders' equity (13.013 208.343 $310,513 225.888 $339.779 $274 254 Total liabilites and Sharoholdors' Equity EXHIBIT 32.2 I Consolidated Balance Sheets (in thousands of dollars) Sources of data: Company annual and quarterly reports Fiscal Year Three Months Ended 2004 2003 7/2/06 2005 2006 7/1/07 Restaurant sales Franchise and ofther revenues $356 260 $418.799 $474.738 $547.968 $134.604 $156.592 3.627 3.653 4861 6633 1564 1989 Total revenues 554 601 359.887 422.452 479.599 136,168 158.581 87806 129.702 70,273 287,781 135.848 199,744 108.558 Food beverage and paper supphes Labor Dect operating and occupancy Cost of Sales 103813 152.949 83054 118.480 173,751 92.827 33.090 49.272 26.214 108.576 38,426 56912 30,773 126.111 339.816 385.058 444,150 General and administrative Depreciation and amortizaton Pre-opening costs Severance charges Loss on amparment of PPAE Store closure costs Legal setement resenve 21,488 28.794 23.975 36.298 25.440 4,051 43320 29,489 6964 11.035 7.070 800 12.206 9,022 852 20.714 4,147 1221 18.984 737 1,160 152 600 2.700 1.333 707 768 Operating income 5.552 25.097 26.840 29.971 8,687 9.622 317 571 739 1,105 22) 1822 Intorest ncome 718 287 91 Other income Equty in loss of uncomoidated V Total other income jexpensej 049 (143) 428 (32) 718 287 91 9,713 3.393 $ 5602 $ 17.816 $ 19,490 $21.000 $ 6.013 S 6320 28.662 Income before ncome tax provsion Income tax provsion benatt 5.520 (82) 25.525 7.709 30,689 8974 2.961 9689 9,172 Net income Net income per common share Basc Dded S 030 S 029 020 022 0 20 $ 021 093 101 $ 1.08 $ 106 0.92 099 Selectod Operating Data Restaurants open at end of penod Company owned open at end of penod Avg weekly full service rest sales 18mo comparable rest sales growth 168 171 188 205 193 213 137 176 57,509 $ 62.383 $65,406 $65,427 $ 68,535 5.9% 157 162 141 182 54,896 34 80% 75% 48% 5.4% EXHIBIT 32.3 I Consolidated Income Statements (in thousands of dollars, except per-share data) Notes For the years ended December 31, 2006, January 1, 2006, and January 2, 2005, December 2n, 2003 igeverance charges represent payments to former president/CEO and former senior vice presidentisenior development officer under the lems of their separation agreaments pData for company-owned restaurants Sources of data: Company annual and quarterly reports and quarterly company eamings conlerence cals EXHIBIT 32.41 Selected Historical Comparable Store Sales (calendarized) CYOG CY07 CYD4 CYOS 01 02 03 04 Q1 Calfornia Puza Khchen 34% 47% 92 64% 5.9% 56% 69% Applebee's Intomabonal, Inc BJ's Rostaurants, Inc 4.1% 48% 40% 18% 46% 32% 26% 68% 27% -1.8% 5.9% -23% 53% -1.1% 55% -21% -40% 69% -44 % 3.3% 2.1% -2 t -16% 19% 39% 133 Brnker Intemanonal -20% -08% The Cheesecake Factory, Inc Chipotle Mexcan Grt, Inc Darden Restaurants, Inc-Red Lobster Darden Restaurants, Inc-Ove Garden McComck &Schmck's Seafood Restaurants, Inc Panera Bread Company PF Chang's Cha Btro RARE-Longhom Steakhouse Red Robn Gourmet Burgers Ruth's Chs Steak House, Inc Sonc Corporaton Texas Roadhouse, Inc 07% 24.4% 00% 17% -12% 19 7 04% 8.3% 46% 10.1 07% 29% 20% 20% 10.2% 42% 145% 94% 25% 11.6 -39% 47% 38% -21% 29% 29% 16x 57 22% 1.1% 07% 86% 20% 78% 12% 28% 38% 104% 10% 28% 00% 23% 32% -10% -04% 4.1% 28% -05% -03% 90% 13% a7% -25% -10% -05% 19% 5.1% 46% 30% -09% 15% 02% 50% 75% 41% 48% 68% 55% 33% 60% 43% 11.6% 7.0% 7% 43% 40% 23% 74% 14% 20% 09% 54% 34% 16% 35% 32% 12% 64% Note pinker's comparable store sales were a biended rate for ts various brands Source of data Keyane Capital Markets equity search 2009 2008E 2007E Price Target Date of Revenues EPS Report Revenues EPS Revenues EPS NA NA $1.33 129 1.28 131 133 NA 755.1 NA 157 NA $40 37 5652 9 6475 Oppenhemer and Ce Inc CeC Wold Markots Keyan Captal Markat eC Capal Makos Morgan Keegan & Co. In MOM Partners 4907 4/12/07 5/11/07 5/11/07 5/11/07 NA 155 159 158 NA 878 2 NA NA NA 190 NA NA 7531 742 543 NA 37 NA NA 6507 6442 NA 169 29 6475 134 5/11/07 EXHIBIT 32.5I Selected Forecasts for Califomia Pizza Ktchen Source of data: Selected Sms eqguly sch EXHIBIT 32.7 I Comparative Restaurant Financial Data, 2006 Fiscal Year (in millions of dollars, except per-share data) Fiscal 7/2/2007 Year End Month Share EBITDA Margin Net Profit Margin Eamings per Share Dvidends per Share Book Value Price Revenue per Share Beta Calfomia Ptzza Kitchen Dec $22.10 $55 1,338 239 4,151 278 1,315 823 5,721 291 308 829 10.7% 38% $0.71 $000 $7.20 0.85 Applobee's Intemational, Inc BJs Restaurants, Inc Brinker Intenatonaf Buftalo Wild Wings, Inc The Cheesecake Factory, Inc. Chipotle Mexican Grill Inc. Darden Restaurants, Inc Frisch's Restaurants, Inc. Dec Dec June Dec Dec Dec May May Dec Dec Dec Dec Dec Dec 24.28 15.9% 9.6% 6.5% 4.1% 1.17 0.41 0.20 0.00 0.20 0.00 0.00 6.49 7.78 0.80 1.05 0.90 1.10 100 20.05 29.37 41.78 24.57 86.00 44.14 30.54 25.66 46.02 35.37 26.76 40.19 12.0 % 13.3 % 12.2% 1.49 0.93 1.02 128 2.16 4.7% 5.8% 6.2% 8.59 661 909 1456 8.37 19.84 11.20 12.53 11.41 11.17 14.68 2.93 13.0 % 13.2% 31.6% 9.7% 16.3% 10.5 % 5.0% 5.9% 3.1% 4.3% 0.00 NA 100 0.60 0.40 0.44 1.78 McCormick & Schmick's Panera Bread Company PF. Chang's China Bistro RARE Hospitality Int1 Inc Red Robin Gourmet Burgers Ruth's Chris Steak House, Inc. Sonic Corporation Texas Roadhouse, Inc. 0.92 0.00 0.00 1.10 125 1.10 057 105 NA 0.90 7.2 % 36% 187 124 1.45 1.82 1.01 0.88 0.44 938 0.00 987 11.6 13.7% 15.6 5.1% 49 % 8.7% 0.00 0.00 0.00 0.00 0.00 619 272 693 597 16.80 Aug Dec 22.00 114% 57% 24.9% 2.5% 466 12.81 430 090 Total Return on Current Assets Current Llabilities Total Share Equity Capital Turnover Debt Capital Interest Coverage Debt Capital Equity Californla Pizza Kitchen $ 38 $ 66 $ 0 $ 208 0 0% NMF 2.7 10.1% 10.1% Applebee's Intemational, Inc BJ's Restaurants, Inc 105 96 175 0 11.7 NMF 187 36 487 203 265% 20 14.0% 49% 13.2% 14.0% 18.0% 4.9% 18.0% 14.0 % 11.4% 8.7% 27.5% 00% 318% 0.0% 00% 00% 344% 30.1% 02% 0.0% 62% 31.6% 319% 500% 28.9% 10.2% 1.2 26 24 Brinker Intenationaf Buffalo Wild Wings, Inc. The Cheesecake Factory, Inc. Chipotle Mexican Grill, Inc Darden Restaurants, Inc Frisch's Rostaurants, Inc. McCormick & Schmick's 242 75 203 179 502 1,076 116 497 26 163 61 1,026 31 40 144 NMF NME NMF 10.9 5.9 NMF 0 712 1.8 11.4% 0 645 43 474 1.230 101 160 398 290 360 1.7 3.1 20 88% 206% 79% 8.3% 15.1% 11.1% 9.8% 9.1% 8.3% 15.1% 11.5% 139% 12.5% 34.9% 20.1% 10.7% 1.9 2.1 30 1.9 Panera Bread Company P.F. Chang's China Bistro RARE Hospitality Int1 Inc Red Roben Gourmot Burgers Ruth's Chris Steak House, Inc Sonac Corporation Texas Roadhouse, Inc. 0 19 166 110 NMF NME 104 29.2 7.7 12.8 15.0 134 70 59 78 78 114 68 159 36 244 68 392 319 1.7 20 1.3 1.7 9.3% 18.6% 15.3% 9.7% 19.9 Notes (1)For the years ended December 31, 2006, January 1, 2006 and January 2, 2005, December 28, 2003. under the tems of their senaration anreements (20 e-t m nto f eagsgazes us. Treasury Securities Corporate bonds Moody's) Bs Average Prime Average LIBOR 3month Notes &Bonds 3-month Gmonth 3year 10-year 30-year Aaa 3 Baa Lending 2000 2001 2002 2003 2004 2005 5.85% 3.45% 1.62 % 1.02% 138% 3.16 592% 3.39% 1.69% 1.06% 1.58% 340% 622% 409% 310% 6.03% 5.02% 461% 5.94% 5.49% 762% 7 08% 649% 5.67% 5.63% 524% 836% 7.95% 7.80% 6.77% 6.39% 6.06 9.23% 691% 4.67% 655% 363% 1.79% 1.22% 167% 3.63% 2.10% 2.78% 393% 401% 427% 4.29% 4.12% 434% 6.19% 2006 Jan 420% 430% 451% 461% 472% 481% 495% 5.09% 499 490% 491% 435% 464% 474% 489% 497% 509% 507% 4.85% 4.69% 4729 442% 457% 5.29% 5.35% 5.57% 5.84% 5.95% 5.89% 5.85% 5.68% 5.51% 551% 6.24% 6.27% 6.41% 668% 6.75% 6.78% 6.76% 7.38% 4.68% 482% Feb Mar . May 441% 451% 459% 472 479% 496% 498% 482% 489% 495% 485% 4.54% 473% 5.06 520% 5.15% 5.13% 5.00% 485% 485% 469% 468% 750% 763% 7.75% 788% 7.13% 825% 8.25% 8.25% 8.25% 8.25% 825% 472% 499% 4.99% 5.15% 5.11% 5.22% 5.51% 5.49% 5.40% 5.37% 5.37% 5.37% 5.36% June July Aug Sept Oct 511% 509% 488 472 473% 4.60% 4.56% 659% 643% 6.42% 620% 6.22% Nov Dec 4.96% 4.64% 458% 5.33% 5.32% 488% 2007: Jan Feb Mar Apr May June 496% 5.02% 497 494% 497% 4.90 487% 4 80% 477% 479% 475% 451% 460% 469% 500% 4.76% 472% 4.56% 4.69% 475% 5.10% 485% 4.82% 472% 487% 490% 520% 8.25% 825% 8.25% 8.25% 8.25% 825% 5.40% 5.39% 5.30% 5.47% 5.47% 6.34% 6.28% 5.36% 5.36% 6.27% 6.39% 6.39% 6.70% 5.35% 5.36% 5.36% 536 488% 477% 4.67% 5.79% EXHIBIT 32.8 1 Interest Rates and Yields Sources of data: Economic Report of the President and Fannie Mae Web ste EXHIBIT 32.9 I Pro Forma Tax Shield Effect of Recapitalization Scenarios (dollars in thousands, except share data; figures based on end of June 2007) Dobt/Total Caplital 20 % Actual 10% 30% Interest rate ato 6.16% 32.5% 6.16% 32.5% 6.16% 32.5% 6.16% 32.5 % Earnings before income taxes and interest Interest expense 30,054 30,054 30,054 30,054 0 1,391 2.783 4.174 25.880 8.400 Earnings before taxes Income taxes 30,054 9.755 20.299 28.663 27.271 8,852 18,419 9,303 17,480 Net Income 19,359 Book value Debt 0 22,589 203.299 45,178 180,710 67.766 Equity Total capital 158.122 225.888 225,888 225,888 225,888 225,888 Market value: Deb Equity 67,766 598,002 665,769 22.589 628,516 45.178 0 643773 613.259 651,105 658.437 643.773 Market value of capital Notes: (interest rate of CPK's credit facility with Bank of America: LIBOR+ 0.80 %. Earmings belore interest and taxes (EBIT) include interest income. pMarket values of debt equal book values. (4Actual market value of equity equals the share price (522.10) multiplied by the current number of shares outstanding (29.13 million) Source: Case writer analysis based on CPK financial data 2. How does debt add value to CPK? a. Add the following values to the table provide in Exhibit 9 and complete it pm for the actual scenario and the three proposed scenarios: Market value of Debt/MV of Capital Price per share Shares repurchased (thousands) Shares outstanding (thousands) Earnings per share Price to earning ratio Beta Cost of equity I WACC unk vered Present value of tax shield using perpetuity formula (kex Dx t)/ka=Dxt. Post-announcement share price= PN=Pre-Announcement Price + Dx t/shares outstanding. Number of shares repurchased = DIPN. Cost of Equity Risk Free Rate(Given in Ex. 8)+ Beta*(MRP=5%) WACC: Use MV weights and Debt Rate provided and Cost of Equity calculated As of 1/1/06 12/31/06 7/1/07 Assets Current assets Cash and cash equvalents Investments in marketable securties Other recevables Inventones Current deferred tax asset, not Propaid income tax Other prepaid expenses and other curent assets $ 7,178 s 8,187 $ 11,272 11,408 4,109 3,776 8437 1,428 5,492 45.922 7876 4.745 11,721 10,709 4.596 11.834 8.769 5.388 6.444 37,917 49.530 Total current assets 271867 6.328 5,754 6.300 213408 4513 5.967 4444 $274.254 255,382 5867 5.825 5.522 Property and equpment, not Noncgront deferred tax assot, not Good and other intangbles Other assets $310.513 $339,779 Total assets Labilities and Sharoholders Equity Current kabdines Accounts payable Accrued compensation and bonehts $ 7,054 13.068 S 14.115 15572 S15.044 15,042 14.532 4494 13.275 3614 14.979 5,135 13.980 9,012 13.253 4.056 9294 Accrued rent Defered rent credts Other accrued labntes Accrued ncote tax 72.793 66.001 46,725 Total curment habes 8.683 27,486 8,662 32436 5.383 24.810 Other labes Defemed rent credits net of curent porticn Shareholders oquty Common stock 291 228.647 (3.050) 193 221,163 197 231.159 04.013 (h 197.336 Additonal paidan-captal Accumulated defict Accumulated comprehonsive loss Total shareholders' equity (13.013 208.343 $310,513 225.888 $339.779 $274 254 Total liabilites and Sharoholdors' Equity EXHIBIT 32.2 I Consolidated Balance Sheets (in thousands of dollars) Sources of data: Company annual and quarterly reports Fiscal Year Three Months Ended 2004 2003 7/2/06 2005 2006 7/1/07 Restaurant sales Franchise and ofther revenues $356 260 $418.799 $474.738 $547.968 $134.604 $156.592 3.627 3.653 4861 6633 1564 1989 Total revenues 554 601 359.887 422.452 479.599 136,168 158.581 87806 129.702 70,273 287,781 135.848 199,744 108.558 Food beverage and paper supphes Labor Dect operating and occupancy Cost of Sales 103813 152.949 83054 118.480 173,751 92.827 33.090 49.272 26.214 108.576 38,426 56912 30,773 126.111 339.816 385.058 444,150 General and administrative Depreciation and amortizaton Pre-opening costs Severance charges Loss on amparment of PPAE Store closure costs Legal setement resenve 21,488 28.794 23.975 36.298 25.440 4,051 43320 29,489 6964 11.035 7.070 800 12.206 9,022 852 20.714 4,147 1221 18.984 737 1,160 152 600 2.700 1.333 707 768 Operating income 5.552 25.097 26.840 29.971 8,687 9.622 317 571 739 1,105 22) 1822 Intorest ncome 718 287 91 Other income Equty in loss of uncomoidated V Total other income jexpensej 049 (143) 428 (32) 718 287 91 9,713 3.393 $ 5602 $ 17.816 $ 19,490 $21.000 $ 6.013 S 6320 28.662 Income before ncome tax provsion Income tax provsion benatt 5.520 (82) 25.525 7.709 30,689 8974 2.961 9689 9,172 Net income Net income per common share Basc Dded S 030 S 029 020 022 0 20 $ 021 093 101 $ 1.08 $ 106 0.92 099 Selectod Operating Data Restaurants open at end of penod Company owned open at end of penod Avg weekly full service rest sales 18mo comparable rest sales growth 168 171 188 205 193 213 137 176 57,509 $ 62.383 $65,406 $65,427 $ 68,535 5.9% 157 162 141 182 54,896 34 80% 75% 48% 5.4% EXHIBIT 32.3 I Consolidated Income Statements (in thousands of dollars, except per-share data) Notes For the years ended December 31, 2006, January 1, 2006, and January 2, 2005, December 2n, 2003 igeverance charges represent payments to former president/CEO and former senior vice presidentisenior development officer under the lems of their separation agreaments pData for company-owned restaurants Sources of data: Company annual and quarterly reports and quarterly company eamings conlerence cals EXHIBIT 32.41 Selected Historical Comparable Store Sales (calendarized) CYOG CY07 CYD4 CYOS 01 02 03 04 Q1 Calfornia Puza Khchen 34% 47% 92 64% 5.9% 56% 69% Applebee's Intomabonal, Inc BJ's Rostaurants, Inc 4.1% 48% 40% 18% 46% 32% 26% 68% 27% -1.8% 5.9% -23% 53% -1.1% 55% -21% -40% 69% -44 % 3.3% 2.1% -2 t -16% 19% 39% 133 Brnker Intemanonal -20% -08% The Cheesecake Factory, Inc Chipotle Mexcan Grt, Inc Darden Restaurants, Inc-Red Lobster Darden Restaurants, Inc-Ove Garden McComck &Schmck's Seafood Restaurants, Inc Panera Bread Company PF Chang's Cha Btro RARE-Longhom Steakhouse Red Robn Gourmet Burgers Ruth's Chs Steak House, Inc Sonc Corporaton Texas Roadhouse, Inc 07% 24.4% 00% 17% -12% 19 7 04% 8.3% 46% 10.1 07% 29% 20% 20% 10.2% 42% 145% 94% 25% 11.6 -39% 47% 38% -21% 29% 29% 16x 57 22% 1.1% 07% 86% 20% 78% 12% 28% 38% 104% 10% 28% 00% 23% 32% -10% -04% 4.1% 28% -05% -03% 90% 13% a7% -25% -10% -05% 19% 5.1% 46% 30% -09% 15% 02% 50% 75% 41% 48% 68% 55% 33% 60% 43% 11.6% 7.0% 7% 43% 40% 23% 74% 14% 20% 09% 54% 34% 16% 35% 32% 12% 64% Note pinker's comparable store sales were a biended rate for ts various brands Source of data Keyane Capital Markets equity search 2009 2008E 2007E Price Target Date of Revenues EPS Report Revenues EPS Revenues EPS NA NA $1.33 129 1.28 131 133 NA 755.1 NA 157 NA $40 37 5652 9 6475 Oppenhemer and Ce Inc CeC Wold Markots Keyan Captal Markat eC Capal Makos Morgan Keegan & Co. In MOM Partners 4907 4/12/07 5/11/07 5/11/07 5/11/07 NA 155 159 158 NA 878 2 NA NA NA 190 NA NA 7531 742 543 NA 37 NA NA 6507 6442 NA 169 29 6475 134 5/11/07 EXHIBIT 32.5I Selected Forecasts for Califomia Pizza Ktchen Source of data: Selected Sms eqguly sch EXHIBIT 32.7 I Comparative Restaurant Financial Data, 2006 Fiscal Year (in millions of dollars, except per-share data) Fiscal 7/2/2007 Year End Month Share EBITDA Margin Net Profit Margin Eamings per Share Dvidends per Share Book Value Price Revenue per Share Beta Calfomia Ptzza Kitchen Dec $22.10 $55 1,338 239 4,151 278 1,315 823 5,721 291 308 829 10.7% 38% $0.71 $000 $7.20 0.85 Applobee's Intemational, Inc BJs Restaurants, Inc Brinker Intenatonaf Buftalo Wild Wings, Inc The Cheesecake Factory, Inc. Chipotle Mexican Grill Inc. Darden Restaurants, Inc Frisch's Restaurants, Inc. Dec Dec June Dec Dec Dec May May Dec Dec Dec Dec Dec Dec 24.28 15.9% 9.6% 6.5% 4.1% 1.17 0.41 0.20 0.00 0.20 0.00 0.00 6.49 7.78 0.80 1.05 0.90 1.10 100 20.05 29.37 41.78 24.57 86.00 44.14 30.54 25.66 46.02 35.37 26.76 40.19 12.0 % 13.3 % 12.2% 1.49 0.93 1.02 128 2.16 4.7% 5.8% 6.2% 8.59 661 909 1456 8.37 19.84 11.20 12.53 11.41 11.17 14.68 2.93 13.0 % 13.2% 31.6% 9.7% 16.3% 10.5 % 5.0% 5.9% 3.1% 4.3% 0.00 NA 100 0.60 0.40 0.44 1.78 McCormick & Schmick's Panera Bread Company PF. Chang's China Bistro RARE Hospitality Int1 Inc Red Robin Gourmet Burgers Ruth's Chris Steak House, Inc. Sonic Corporation Texas Roadhouse, Inc. 0.92 0.00 0.00 1.10 125 1.10 057 105 NA 0.90 7.2 % 36% 187 124 1.45 1.82 1.01 0.88 0.44 938 0.00 987 11.6 13.7% 15.6 5.1% 49 % 8.7% 0.00 0.00 0.00 0.00 0.00 619 272 693 597 16.80 Aug Dec 22.00 114% 57% 24.9% 2.5% 466 12.81 430 090 Total Return on Current Assets Current Llabilities Total Share Equity Capital Turnover Debt Capital Interest Coverage Debt Capital Equity Californla Pizza Kitchen $ 38 $ 66 $ 0 $ 208 0 0% NMF 2.7 10.1% 10.1% Applebee's Intemational, Inc BJ's Restaurants, Inc 105 96 175 0 11.7 NMF 187 36 487 203 265% 20 14.0% 49% 13.2% 14.0% 18.0% 4.9% 18.0% 14.0 % 11.4% 8.7% 27.5% 00% 318% 0.0% 00% 00% 344% 30.1% 02% 0.0% 62% 31.6% 319% 500% 28.9% 10.2% 1.2 26 24 Brinker Intenationaf Buffalo Wild Wings, Inc. The Cheesecake Factory, Inc. Chipotle Mexican Grill, Inc Darden Restaurants, Inc Frisch's Rostaurants, Inc. McCormick & Schmick's 242 75 203 179 502 1,076 116 497 26 163 61 1,026 31 40 144 NMF NME NMF 10.9 5.9 NMF 0 712 1.8 11.4% 0 645 43 474 1.230 101 160 398 290 360 1.7 3.1 20 88% 206% 79% 8.3% 15.1% 11.1% 9.8% 9.1% 8.3% 15.1% 11.5% 139% 12.5% 34.9% 20.1% 10.7% 1.9 2.1 30 1.9 Panera Bread Company P.F. Chang's China Bistro RARE Hospitality Int1 Inc Red Roben Gourmot Burgers Ruth's Chris Steak House, Inc Sonac Corporation Texas Roadhouse, Inc. 0 19 166 110 NMF NME 104 29.2 7.7 12.8 15.0 134 70 59 78 78 114 68 159 36 244 68 392 319 1.7 20 1.3 1.7 9.3% 18.6% 15.3% 9.7% 19.9 Notes (1)For the years ended December 31, 2006, January 1, 2006 and January 2, 2005, December 28, 2003. under the tems of their senaration anreements (20 e-t m nto f eagsgazes us. Treasury Securities Corporate bonds Moody's) Bs Average Prime Average LIBOR 3month Notes &Bonds 3-month Gmonth 3year 10-year 30-year Aaa 3 Baa Lending 2000 2001 2002 2003 2004 2005 5.85% 3.45% 1.62 % 1.02% 138% 3.16 592% 3.39% 1.69% 1.06% 1.58% 340% 622% 409% 310% 6.03% 5.02% 461% 5.94% 5.49% 762% 7 08% 649% 5.67% 5.63% 524% 836% 7.95% 7.80% 6.77% 6.39% 6.06 9.23% 691% 4.67% 655% 363% 1.79% 1.22% 167% 3.63% 2.10% 2.78% 393% 401% 427% 4.29% 4.12% 434% 6.19% 2006 Jan 420% 430% 451% 461% 472% 481% 495% 5.09% 499 490% 491% 435% 464% 474% 489% 497% 509% 507% 4.85% 4.69% 4729 442% 457% 5.29% 5.35% 5.57% 5.84% 5.95% 5.89% 5.85% 5.68% 5.51% 551% 6.24% 6.27% 6.41% 668% 6.75% 6.78% 6.76% 7.38% 4.68% 482% Feb Mar . May 441% 451% 459% 472 479% 496% 498% 482% 489% 495% 485% 4.54% 473% 5.06 520% 5.15% 5.13% 5.00% 485% 485% 469% 468% 750% 763% 7.75% 788% 7.13% 825% 8.25% 8.25% 8.25% 8.25% 825% 472% 499% 4.99% 5.15% 5.11% 5.22% 5.51% 5.49% 5.40% 5.37% 5.37% 5.37% 5.36% June July Aug Sept Oct 511% 509% 488 472 473% 4.60% 4.56% 659% 643% 6.42% 620% 6.22% Nov Dec 4.96% 4.64% 458% 5.33% 5.32% 488% 2007: Jan Feb Mar Apr May June 496% 5.02% 497 494% 497% 4.90 487% 4 80% 477% 479% 475% 451% 460% 469% 500% 4.76% 472% 4.56% 4.69% 475% 5.10% 485% 4.82% 472% 487% 490% 520% 8.25% 825% 8.25% 8.25% 8.25% 825% 5.40% 5.39% 5.30% 5.47% 5.47% 6.34% 6.28% 5.36% 5.36% 6.27% 6.39% 6.39% 6.70% 5.35% 5.36% 5.36% 536 488% 477% 4.67% 5.79% EXHIBIT 32.8 1 Interest Rates and Yields Sources of data: Economic Report of the President and Fannie Mae Web ste EXHIBIT 32.9 I Pro Forma Tax Shield Effect of Recapitalization Scenarios (dollars in thousands, except share data; figures based on end of June 2007) Dobt/Total Caplital 20 % Actual 10% 30% Interest rate ato 6.16% 32.5% 6.16% 32.5% 6.16% 32.5% 6.16% 32.5 % Earnings before income taxes and interest Interest expense 30,054 30,054 30,054 30,054 0 1,391 2.783 4.174 25.880 8.400 Earnings before taxes Income taxes 30,054 9.755 20.299 28.663 27.271 8,852 18,419 9,303 17,480 Net Income 19,359 Book value Debt 0 22,589 203.299 45,178 180,710 67.766 Equity Total capital 158.122 225.888 225,888 225,888 225,888 225,888 Market value: Deb Equity 67,766 598,002 665,769 22.589 628,516 45.178 0 643773 613.259 651,105 658.437 643.773 Market value of capital Notes: (interest rate of CPK's credit facility with Bank of America: LIBOR+ 0.80 %. Earmings belore interest and taxes (EBIT) include interest income. pMarket values of debt equal book values. (4Actual market value of equity equals the share price (522.10) multiplied by the current number of shares outstanding (29.13 million) Source: Case writer analysis based on CPK financial data
Step by Step Solution
There are 3 Steps involved in it

Get step-by-step solutions from verified subject matter experts