

Question: How does two hospitals given compare to any data given in the last columns ? New York- New York Presbyterian University Langone Hospital/Weill Medical Center
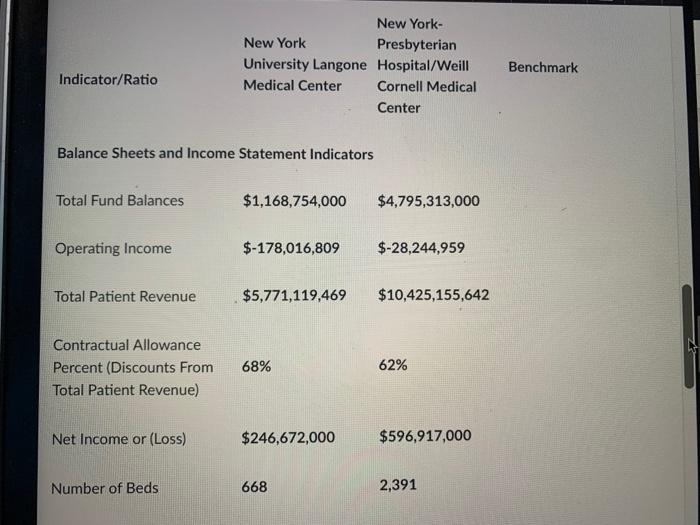
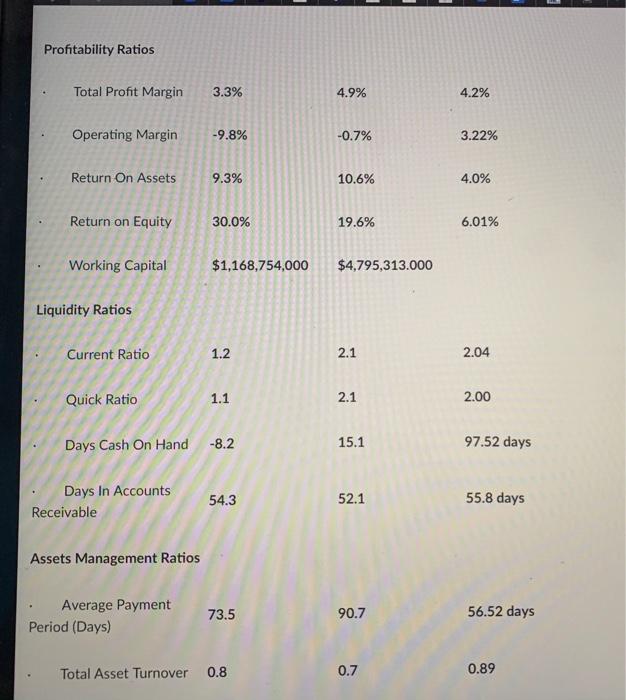
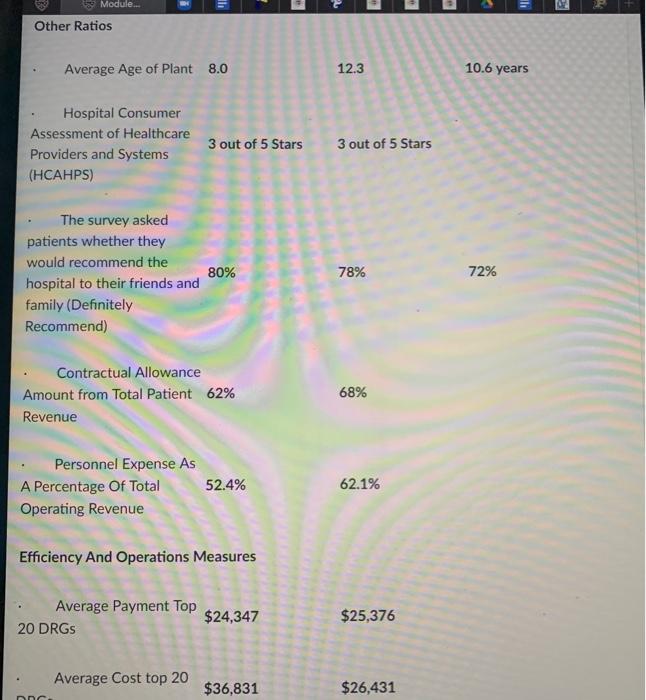
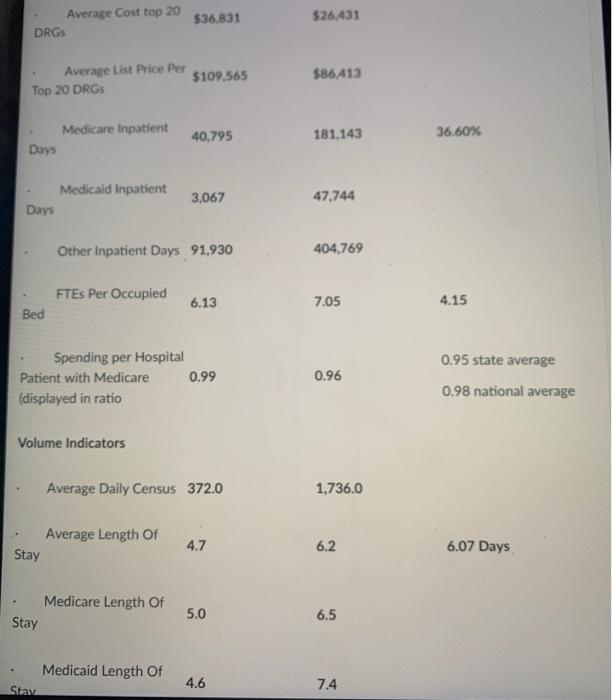
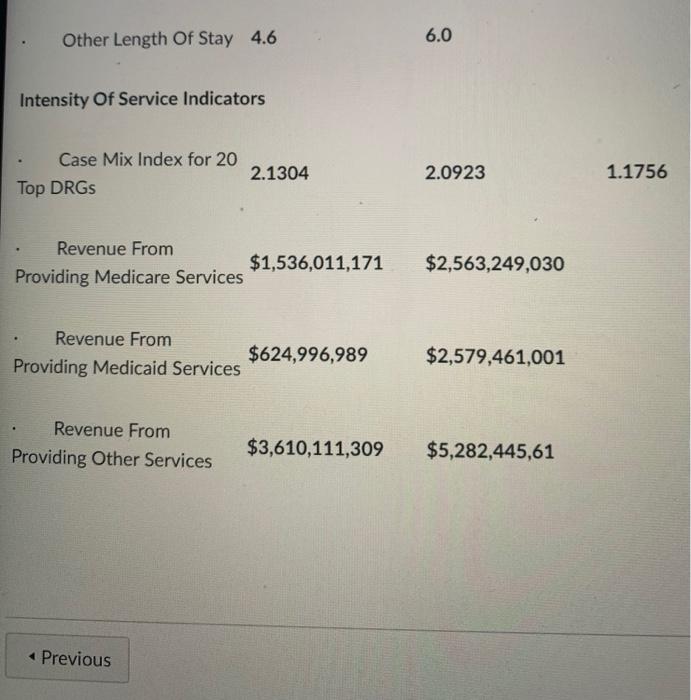
New York- New York Presbyterian University Langone Hospital/Weill Medical Center Cornell Medical Center Benchmark Indicator/Ratio Balance Sheets and Income Statement Indicators Total Fund Balances $1,168,754,000 $4,795,313,000 Operating Income $-178,016,809 $-28,244,959 Total Patient Revenue $5,771,119,469 $10,425,155,642 Contractual Allowance Percent (Discounts From Total Patient Revenue) 68% 62% Net Income or (Loss) $246,672,000 $596,917,000 Number of Beds 668 2,391 Profitability Ratios Total Profit Margin 3.3% 4.9% 4.2% Operating Margin -9.8% -0.7% 3.22% Return On Assets 9.3% 10.6% 4.0% Return on Equity 30.0% 19.6% 6.01% Working Capital $1,168,754,000 $4,795,313.000 Liquidity Ratios Current Ratio 1.2 2.1 2.04 Quick Ratio 1.1 2.1 2.00 Days Cash On Hand -8.2 15.1 97.52 days Days In Accounts Receivable 54.3 52.1 55.8 days Assets Management Ratios Average Payment Period (Days) 73.5 90.7 56.52 days Total Asset Turnover 0.8 0.7 0.89 Module Other Ratios Average Age of Plant 8.0 12.3 10.6 years Hospital Consumer Assessment of Healthcare Providers and Systems (HCAHPS) 3 out of 5 stars 3 out of 5 stars The survey asked patients whether they would recommend the hospital to their friends and family (Definitely Recommend) 80% 78% 72% Contractual Allowance Amount from Total Patient 62% Revenue 68% Personnel Expense As A Percentage Of Total Operating Revenue 52.4% 62.1% Efficiency And Operations Measures Average Payment Top $24,347 20 DRGS $25,376 Average Cost top 20 $36,831 $26,431 Average Cost top 20 DRGS $36,831 $26.431 Average List Price Per Top 20 DRGS $109,565 $86,413 Medicare Inpatient Days 40,795 181.143 36.60% Medicaid Inpatient Days 3,067 47,744 Other Inpatient Days 91,930 404,769 FTES Per Occupied 6.13 7.05 4.15 Bed 0.95 state average Spending per Hospital Patient with Medicare 0.99 (displayed in ratio 0.96 0.98 national average Volume Indicators Average Daily Census 372.0 1,736.0 Average Length Of Stay 4.7 6.2 6.07 Days Medicare Length of Stay 5.0 6.5 Medicaid Length of Stava 4.6 7.4 Other Length Of Stay 4.6 6.0 Intensity Of Service Indicators Case Mix Index for 20 Top DRGS 2.1304 2.0923 1.1756 Revenue From $1,536,011,171 Providing Medicare Services $2,563,249,030 Revenue From $624,996,989 Providing Medicaid Services $2,579,461,001 . Revenue From Providing Other Services $3,610,111,309 $5,282,445,61 Previous New York- New York Presbyterian University Langone Hospital/Weill Medical Center Cornell Medical Center Benchmark Indicator/Ratio Balance Sheets and Income Statement Indicators Total Fund Balances $1,168,754,000 $4,795,313,000 Operating Income $-178,016,809 $-28,244,959 Total Patient Revenue $5,771,119,469 $10,425,155,642 Contractual Allowance Percent (Discounts From Total Patient Revenue) 68% 62% Net Income or (Loss) $246,672,000 $596,917,000 Number of Beds 668 2,391 Profitability Ratios Total Profit Margin 3.3% 4.9% 4.2% Operating Margin -9.8% -0.7% 3.22% Return On Assets 9.3% 10.6% 4.0% Return on Equity 30.0% 19.6% 6.01% Working Capital $1,168,754,000 $4,795,313.000 Liquidity Ratios Current Ratio 1.2 2.1 2.04 Quick Ratio 1.1 2.1 2.00 Days Cash On Hand -8.2 15.1 97.52 days Days In Accounts Receivable 54.3 52.1 55.8 days Assets Management Ratios Average Payment Period (Days) 73.5 90.7 56.52 days Total Asset Turnover 0.8 0.7 0.89 Module Other Ratios Average Age of Plant 8.0 12.3 10.6 years Hospital Consumer Assessment of Healthcare Providers and Systems (HCAHPS) 3 out of 5 stars 3 out of 5 stars The survey asked patients whether they would recommend the hospital to their friends and family (Definitely Recommend) 80% 78% 72% Contractual Allowance Amount from Total Patient 62% Revenue 68% Personnel Expense As A Percentage Of Total Operating Revenue 52.4% 62.1% Efficiency And Operations Measures Average Payment Top $24,347 20 DRGS $25,376 Average Cost top 20 $36,831 $26,431 Average Cost top 20 DRGS $36,831 $26.431 Average List Price Per Top 20 DRGS $109,565 $86,413 Medicare Inpatient Days 40,795 181.143 36.60% Medicaid Inpatient Days 3,067 47,744 Other Inpatient Days 91,930 404,769 FTES Per Occupied 6.13 7.05 4.15 Bed 0.95 state average Spending per Hospital Patient with Medicare 0.99 (displayed in ratio 0.96 0.98 national average Volume Indicators Average Daily Census 372.0 1,736.0 Average Length Of Stay 4.7 6.2 6.07 Days Medicare Length of Stay 5.0 6.5 Medicaid Length of Stava 4.6 7.4 Other Length Of Stay 4.6 6.0 Intensity Of Service Indicators Case Mix Index for 20 Top DRGS 2.1304 2.0923 1.1756 Revenue From $1,536,011,171 Providing Medicare Services $2,563,249,030 Revenue From $624,996,989 Providing Medicaid Services $2,579,461,001 . Revenue From Providing Other Services $3,610,111,309 $5,282,445,61 Previous
Step by Step Solution
There are 3 Steps involved in it

Get step-by-step solutions from verified subject matter experts