

Question: How effectively does PEC handle shipping of back orders from out of region DCs? How does the current back order shipping arrangement working out in
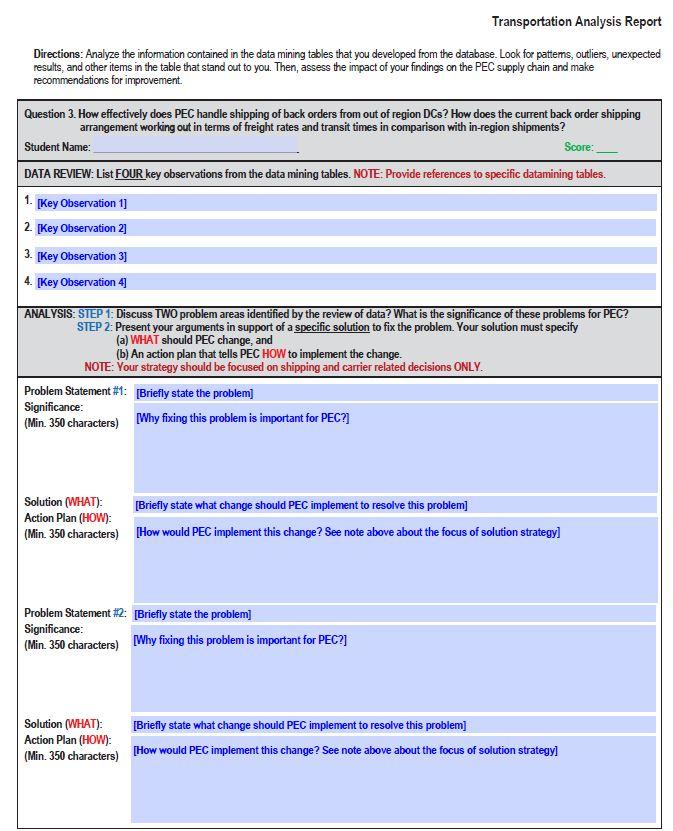
How effectively does PEC handle shipping of back orders from out of region DCs? How does the current back order shipping arrangement working out in terms of freight rates and transit times in comparison with in-region shipments?
ANALYSIS: STEP 1: Discuss TWO problem areas identified by the review of data? What is the significance of these problems for PEC? STEP 2: Present your arguments in support of a specific solution to fix the problem. Your solution must specify (a) WHAT should PEC change, and (b) An action plan that tells PEC HOW to implement the change. NOTE: Your strategy should be focused on shipping and carrier related decisions ONLY.
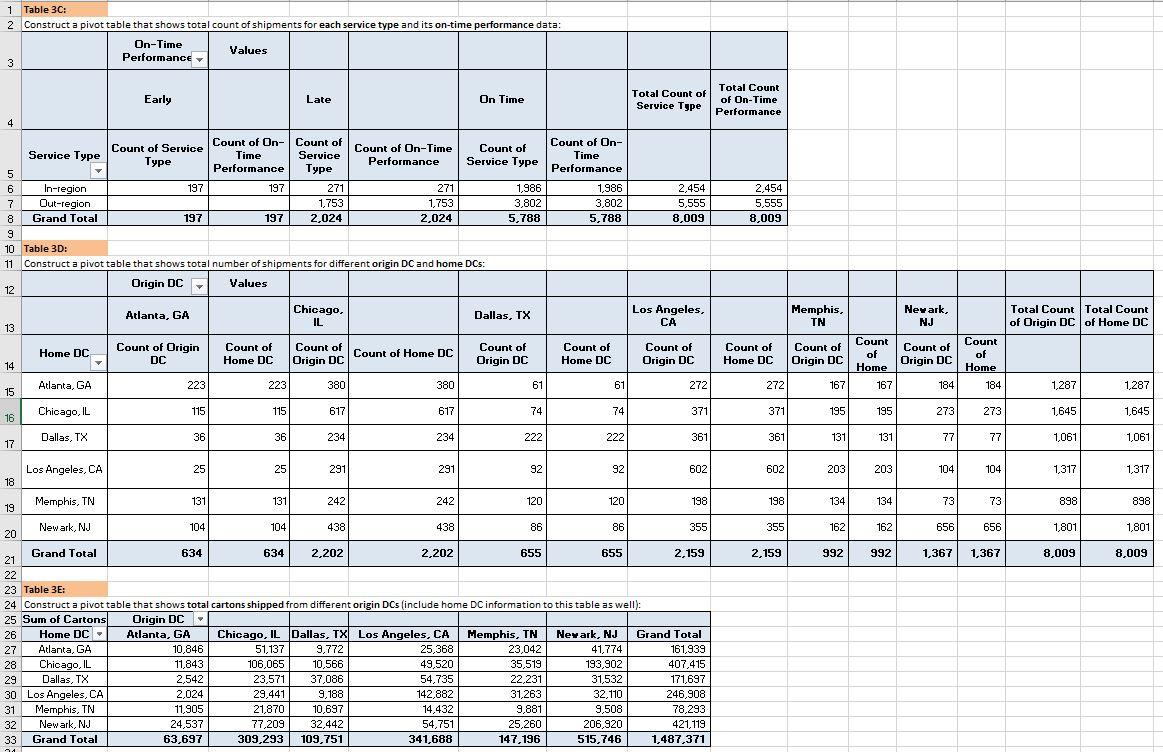
1 Table 3C: 2 Construct a pivot table that shows total count of shipments for each service type and its on-time performance data: On-Time Values 3 Performance Early Late Late On Time On Time Total Count of Service Type Total Count of On-Time Performance 4 Count of On- Time Performance 1.986 3,802 5,788 2,454 5,555 8,009 2,454 5.555 8,009 Count of Service Count of On-Count of Service Type Count of On-Time Count of Time Service Type Performance Service Type Performance 5 Type 6 In-region 197 197 271 271 1,986 7 Out-region 1,753 1,753 3,802 8 Grand Total 197 197 2,024 2,024 5,788 9 9 10 Table 3D: 11 Construct a pivot table that shows total number of shipments for different origin DC and home DCS: Values Origin DC 12 Atlanta, GA Chicago, Dallas, TX 13 IL Count of Origin Count of Home DC Count of Count of DC 14 Home DC Origin DC Atlanta, GA 223 223 380 380 61 15 Chicago, IL 115 115 617 617 74 16 Los Angeles, CA Memphis, Newark, NJ TN Total Count Total Count of Origin DC of Home DC Origin DC Count of Home DC Count of Home DC Count of Origin DC Count of Home DC Count of Origin DC Count of Home 167 Count of Origin DC Count of Home 184 61 272 272 167 184 1,287 1,287 74 371 371 195 195 273 273 1,645 1,645 Dallas, TX 36 36 234 234 222 222 361 361 131 131 77 77 1,061 17 1,061 Los Angeles, CA 25 25 291 291 92 92 602 602 203 203 104 104 1,317 1,317 18 131 Memphis, TN 131 242 242 120 120 198 198 134 134 73 73 898 19 898 Newark, NJ 104 104 438 438 86 86 355 355 162 162 656 656 1,801 20 1,801 2,159 992 992 1.367 1,367 8,009 8,009 Grand Total 634 634 2,202 2,202 655 655 21 2,159 22 23 Table 3E: 24 Construct a pivot table that shows total cartons shipped from different origin DCs (include home DC information to this table as well): 25 Sum of Cartons Origin DC 26 Home DC Atlanta, GA Chicago, IL Dallas, TX Los Angeles, CA Memphis, TN Newark, NJ Grand Total 27 Atlanta, GA 10,846 51,137 9,772 25,36 23,042 41,774 161,939 28 Chicago, IL 11,843 106,065 10,566 49,520 35,519 193.902 407,415 29 Dallas, TX 2,542 23,571 37,086 54,735 22,231 31,532 171,697 30 Los Angeles, CA 2,024 29,441 9,188 142,882 31,263 32,110 246,908 31 Memphis, TN 11,905 21,870 10,697 14,432 9,881 9,508 78,293 32 Newark, NJ 24,537 77,209 32,442 54,751 25,260 206,920 421,119 33 Grand Total 63,697 309,293 109,751 341,688 147,196 515,746 1,487,371 TI Transportation Analysis Report Directions: Analyze the information contained in the data mining tables that you developed from the database. Look for patiems, outliers, unexpected results, and other items in the table that stand out to you. Then, assess the impact of your findings on the PEC supply chain and make recommendations for improvement. Question 3. How effectively does PEC handle shipping of back orders from out of region DCs? How does the current back order shipping arrangement working out in terms of freight rates and transit times in comparison with in-region shipments? Student Name: Score: DATA REVIEW: List FOUR key observations from the data mining tables. NOTE: Provide references to specific datamining tables. 1. [Key Observation 1] 2 Key Observation 2] 3. [Key Observation 3] 4. [Key Observation 4 ANALYSIS: STEP 1: Discuss TWO problem areas identified by the review of data? What is the significance of these problems for PEC? STEP 2: Present your arguments in support of a specific solution to fix the problem. Your solution must specify (a) WHAT should PEC change, and (b) An action plan that tells PEC HOW to implement the change. NOTE: Your strategy should be focused on shipping and carrier related decisions ONLY. Problem Statement #1: Briefly state the problem] Significance: (Min. 350 characters) Why fixing this problem is important for PEC?) Solution (WHAT): [Briefly state what change should PEC implement to resolve this problem Action Plan (HOW): (Min. 350 characters) How would PEC implement this change? See note above about the focus of solution strategy] Problem Statement #2: (Briefly state the problem] Significance: (Min. 350 characters) Why fixing this problem is important for PEC?] Solution (WHAT): [Briefly state what change should PEC implement to resolve this problem] Action Plan (HOW): (Min. 350 characters) How would PEC implement this change? See note above about the focus of solution strategy]
Step by Step Solution
There are 3 Steps involved in it

Get step-by-step solutions from verified subject matter experts