

Question: how I solve this assignment can anyone help me out Complete the following steps to analyze the worksheet before answering the questions. In cell H2
how I solve this assignment
can anyone help me out
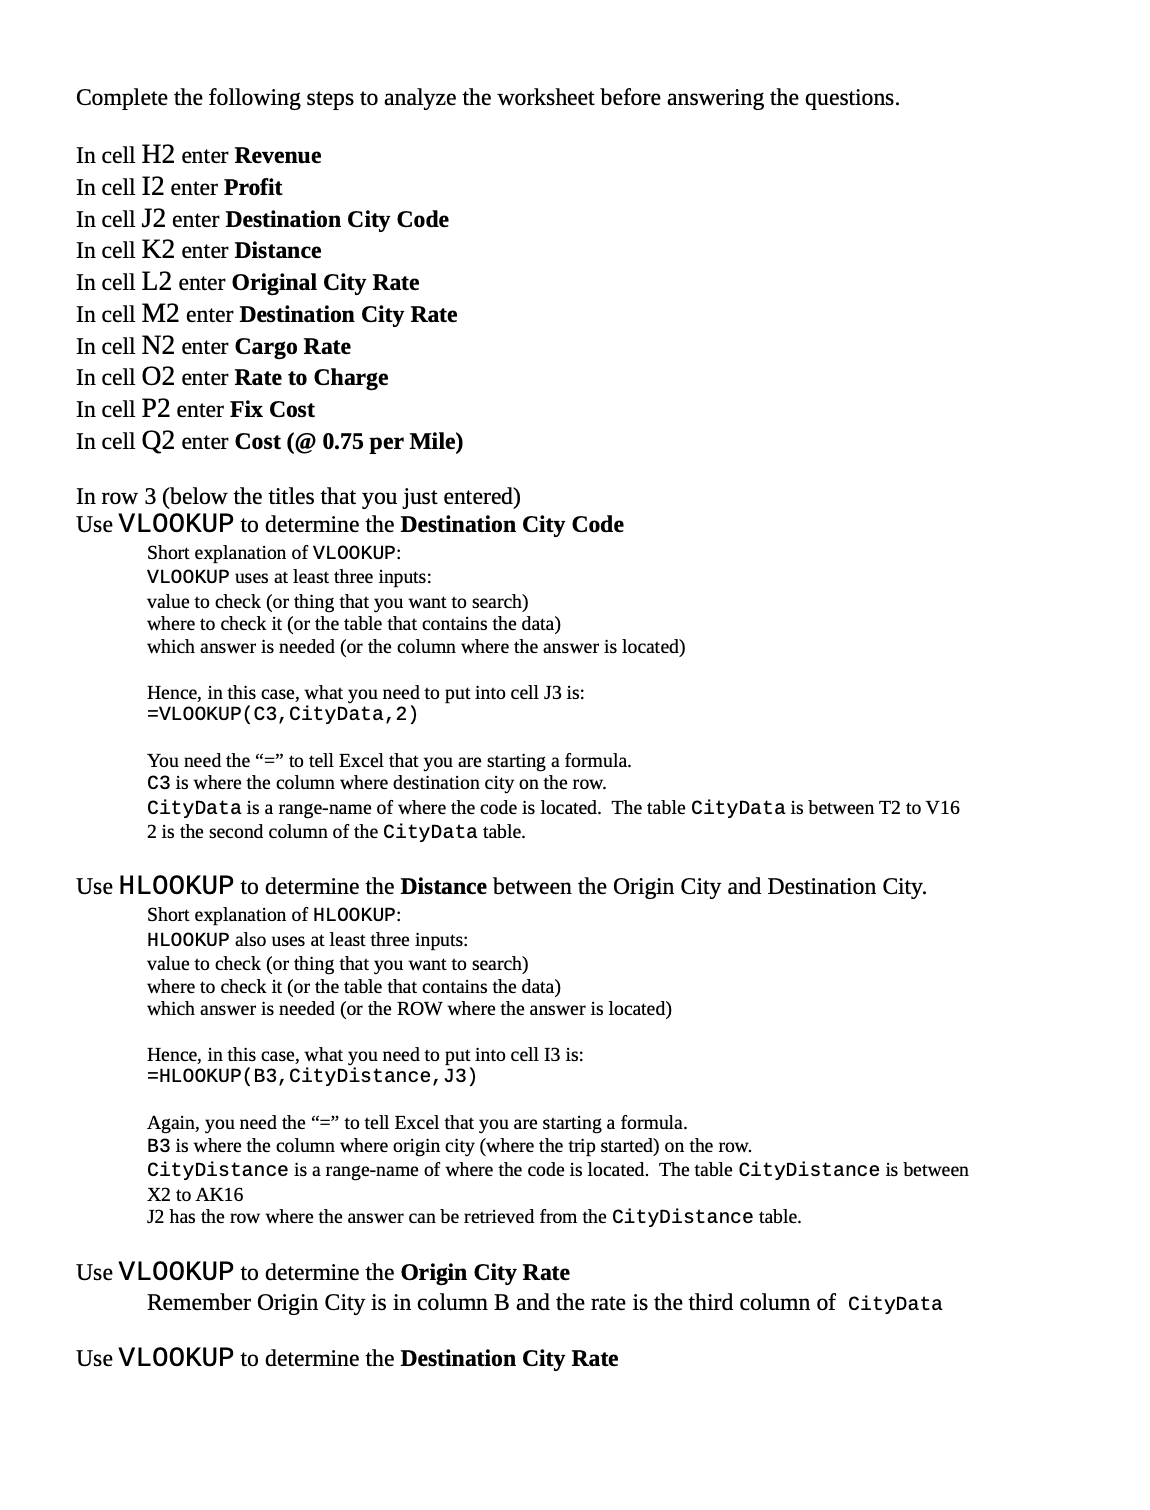
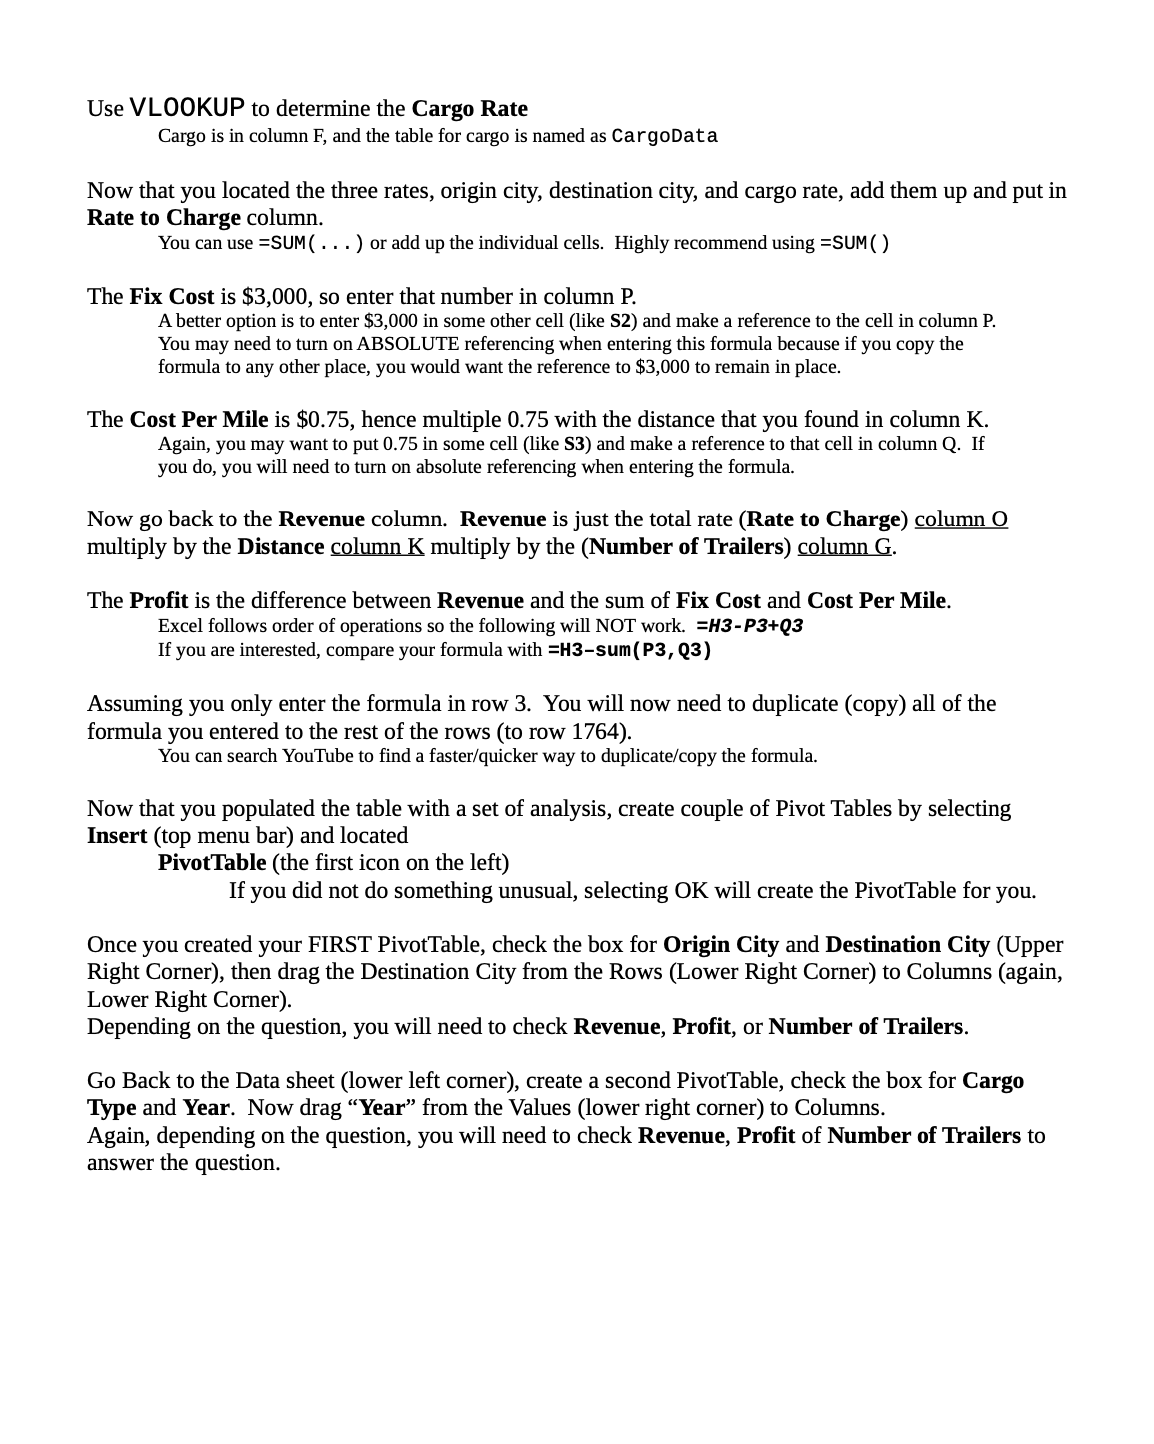
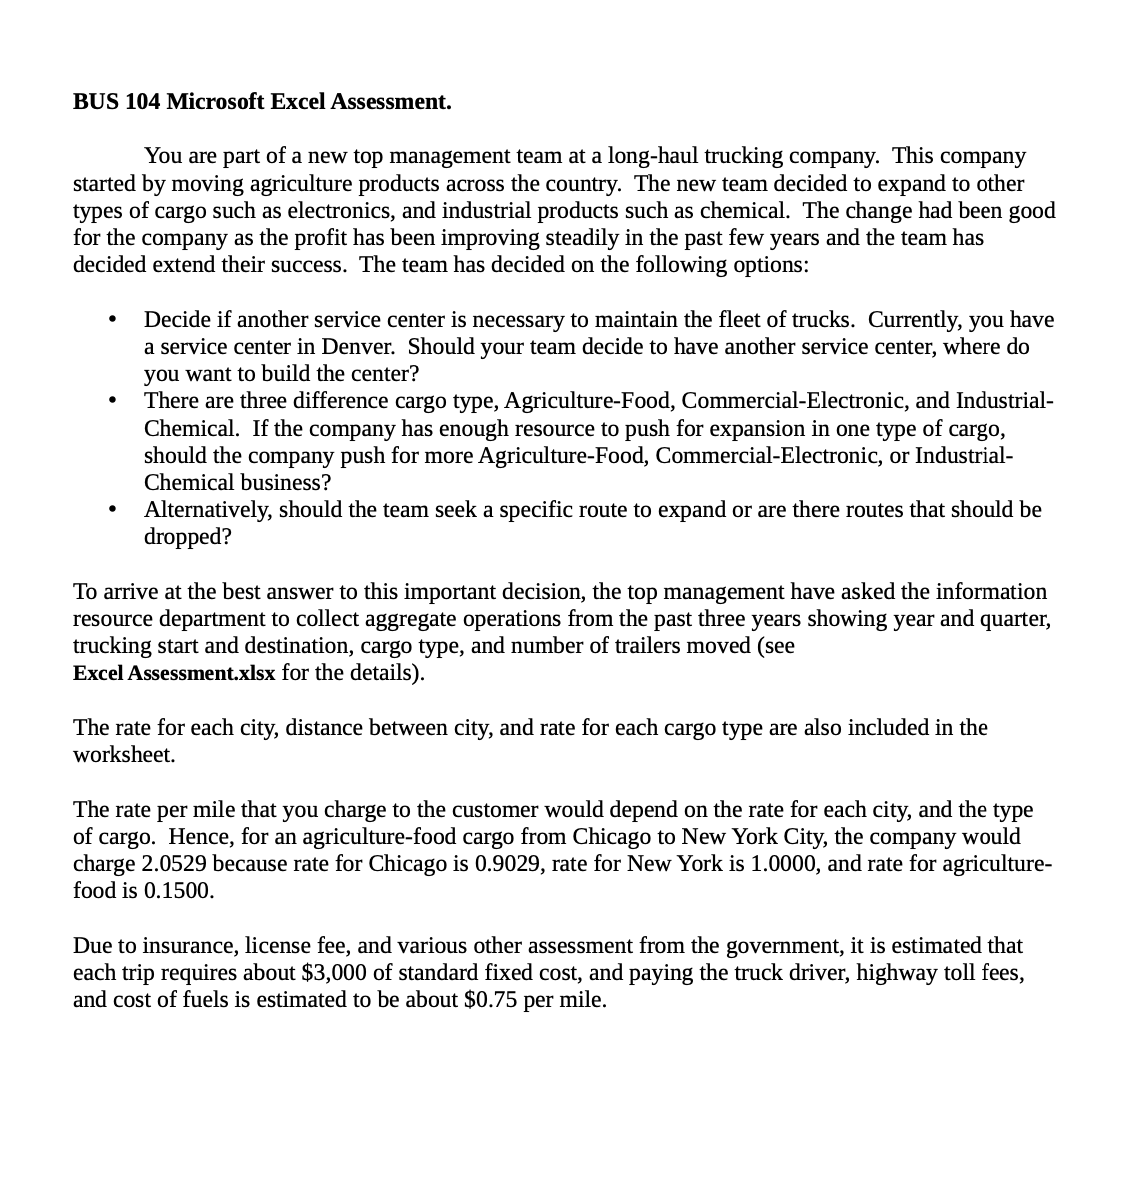
Complete the following steps to analyze the worksheet before answering the questions. In cell H2 enter Revenue In cell 12 enter Prot In cell J2 enter Destination City Code In cell K2 enter Distance In cell L2 enter Original City Rate In cell M2 enter Destination City Rate In cell N2 enter Cargo Rate In cell 02 enter Rate to Charge In cell P2 enter Fix Cost In cell Q2 enter Cost (@ 0.75 per Mile) In row 3 (below the titles that you just entered) Use VLOO KUP to determine the Destination City Code Short explanation of VLOOKUP: VLOOKUP uses at least three inputs: value to check (or thing that you want to search) where to check it (or the table that contains the data) which answer is needed (or the column where the answer is located) Hence, in this case, what you need to put into cell J3 is: =VLO0KUP( CS, CityData, 2) You need the \"=\" to tell Excel that you are starting a formula. C3 is where the column where destination city on the row. CityData is a range-name of where the code is located. The table CityData is between T2 to V16 2 is the second column of the CityData table. Use H L00 KUP to determine the Distance between the Origin City and Destination City. Short explanation of HLOOKUP: HLOOKUP also uses at least three inputs: value to check (or thing that you want to search) where to check it (or the table that contains the data) which answer is needed (or the ROW where the answer is located) Hence, in this case, what you need to put into cell 13 is: =HLO0KUP( 33, CityDistance, .13) Again, you need the \"=\" to tell Excel that you are starting a formula. B3 is where the column where origin city (where the trip started) on the row. CityDistance is a range-name of where the code is located. The table CityDistance is between X2 to AK16 J2 has the row where the answer can be retrieved from the CityDistance table. Use VLOO KUP to determine the Origin City Rate Remember Origin City is in column B and the rate is the third column of CityData Use VLOO KUP to determine the Destination City Rate Use VLOO KUP to determine the Cargo Rate Cargo is in column F, and the table for cargo is named as CargoData Now that you located the three rates, origin city, destination city, and cargo rate, add them up and put in Rate to Charge column. You can use =5UM( . . . ) or add up the individual cells. Highly recommend using =SUM( ) The Fix Cost is $3,000, so enter that number in column P. A better option is to enter $3,000 in some other cell (like 52) and make a reference to the cell in column P. You may need to turn on ABSOLUTE referencing when entering this formula because if you copy the formula to any other place, you would want the reference to $3,000 to remain in place. The Cost Per Mile is $0.75, hence multiple 0.75 with the distance that you found in column K. Again, you may want to put 0.75 in some cell (like 53) and make a reference to that cell in column Q. If you do, you will need to turn on absolute referencing when entering the formula. Now go back to the Revenue column. Revenue is just the total rate (Rate to Charge) column 0 multiply by the Distance columnl multiply by the (Number of 'Ii'ailers) mlumn. The Prot is the difference between Revenue and the sum of Fix Cost and Cost Per Mile. Excel follows order of operations so the following will NOT work. =H3-P3+Q3 If you are interested, compare your formula with =H3sum{P3, Q3) Assuming you only enter the formula in row 3. You will now need to duplicate (copy) all of the formula you entered to the rest of the rows (to row 1764). You can search YouTube to find a fasterlquicker way to duplicatefcopy the formula. Now that you populated the table with a set of analysis, create couple of Pivot Tables by selecting Insert (top menu bar) and located PivotTable (the first icon on the left) If you did not do something unusual, selecting OK will create the PivotTable for you. Once you created your FIRST PivotTable, check the box for Origin City and Destination City (Upper Right Corner), then drag the Destination City from the Rows (Lower Right Comer) to Columns (again, Lower Right Comer). Depending on the question, you will need to check Revenue, Profit, or Number of Trailers. Go Back to the Data sheet (lower left comer), create a second PivotTable, check the box for Cargo Type and Year. Now drag \"Year\" from the Values (lower right corner) to Columns. Again, depending on the question, you will need to check Revenue, Profit of Number of 'Ii'ailers to answer the question. BUS 104 Microsoft Excel Assessment. You are part of a new top management team at a long-haul trucking company. This company started by moving agriculture products across the country. The new team decided to expand to other types of cargo such as electronics, and industrial products such as chemical. The change had been good for the company as the profit has been improving steadily in the past few years and the team has decided extend their success. The team has decided on the following options: 0 Decide if another service center is necessary to maintain the eet of trucks. Cunently, you have a service center in Denver. Should your team decide to have another service center, where do you want to build the center? 0 There are three difference cargo type, Agriculture-Food, Commercial-Electronic, and Industrial- Chemical. If the company has enough resource to push for expansion in one type of cargo, should the company push for more Agriculture-Food, Commercial-Electronic, or Industrial- Chemical business? 0 Alternatively, should the team seek a specific route to expand or are there routes that should be dropped? To arrive at the best answer to this important decision, the top management have asked the information resource department to collect aggregate operations from the past three years showing year and quarter, trucking start and destination, cargo type, and number of trailers moved (see Excel Assessmentxlsx for the details). The rate for each city, distance between city, and rate for each cargo type are also included in the worksheet. The rate per mile that you charge to the customer would depend on the rate for each city, and the type of cargo. Hence, for an agriculture-food cargo from Chicago to New York City, the company would charge 2.0529 because rate for Chicago is 0.9029, rate for New York is 1.0000, and rate for agriculture- food is 0.1500. Due to insurance, license fee, and various other assessment from the government, it is estimated that each trip requires about $3,000 of standard fixed cost, and paying the truck driver, highway toll fees, and cost of fuels is estimated to be about $0.75 per mile
Step by Step Solution
There are 3 Steps involved in it

Get step-by-step solutions from verified subject matter experts