

Question: How many clusters did hierarchical suggest? How many clusters show the best segmentation on t-SNE Cluster Plot? What are the silhouette values for the hierarchical
How many clusters did hierarchical suggest?
How many clusters show the best segmentation on t-SNE Cluster Plot?
What are the silhouette values for the hierarchical vs best t-SNE Cluster?
Look at your descriptives for the cluster split and compare to descriptives for entire data set, create a description for the clusters by looking at the descriptives
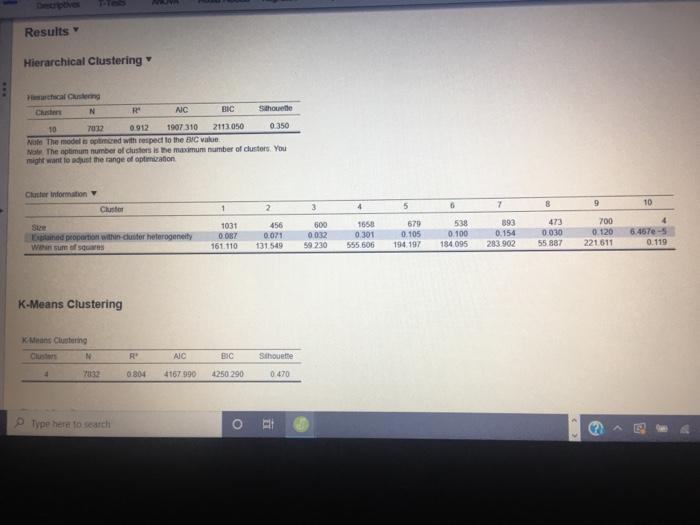
Hierarchical Clustering
Hierarchical Clustering | |||||||||||||||||||||||
Clusters | N | R | AIC | BIC | Silhouette | ||||||||||||||||||
10 | 7032 | 0.912 | 1907.310 | 2113.050 | 0.350 | ||||||||||||||||||
Note. The model is optimized with respect to the BIC value. | |||||||||||||||||||||||
Note. The optimum number of clusters is the maximum number of clusters. You might want to adjust the range of optimization. | |||||||||||||||||||||||
Cluster Information | |||||||||||||||||||||||
Cluster | 1 | 2 | 3 | 4 | 5 | 6 | 7 | 8 | 9 | 10 | |||||||||||||
Size | 1031 | 456 | 600 | 1658 | 679 | 538 | 893 | 473 | 700 | 4 | |||||||||||||
Explained proportion within-cluster heterogeneity | 0.087 | 0.071 | 0.032 | 0.301 | 0.105 | 0.100 | 0.154 | 0.030 | 0.120 | 6.467e-5 | |||||||||||||
Within sum of squares | 161.110 | 131.549 | 59.230 | 555.606 | 194.197 | 184.095 | 283.902 | 55.887 | 221.611 | 0.119 | |||||||||||||
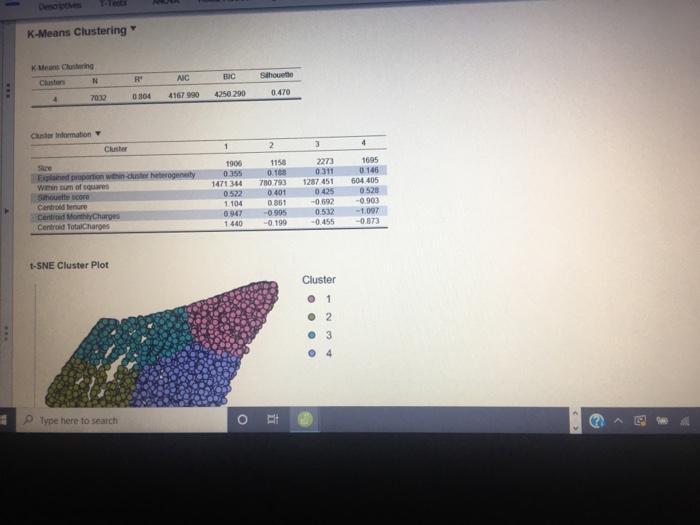
K-Means Clustering
K-Means Clustering | |||||||||||
Clusters | N | R | AIC | BIC | Silhouette | ||||||
7 | 7032 | 0.897 | 2218.970 | 2362.990 | 0.430 | ||||||
Cluster Information | |||||||||||||||
Cluster | 1 | 2 | 3 | 4 | 5 | 6 | 7 | ||||||||
Size | 1301 | 734 | 1021 | 923 | 1156 | 1069 | 828 | ||||||||
Explained proportion within-cluster heterogeneity | 0.129 | 0.130 | 0.183 | 0.118 | 0.211 | 0.087 | 0.142 | ||||||||
Within sum of squares | 281.690 | 283.400 | 397.793 | 256.663 | 458.601 | 188.961 | 309.859 | ||||||||
Silhouette score | 0.446 | 0.354 | 0.328 | 0.336 | 0.482 | 0.557 | 0.487 | ||||||||
Centroid tenure | -1.007 | 1.064 | 0.015 | -0.832 | 1.283 | -0.868 | 0.878 | ||||||||
Centroid MonthlyCharges | 0.581 | 0.104 | 0.764 | -0.417 | 1.176 | -1.414 | -1.299 | ||||||||
Centroid TotalCharges | -0.723 | 0.737 | 0.260 | -0.725 | 1.816 | -0.899 | -0.404 | ||||||||
t-SNE Cluster Plot
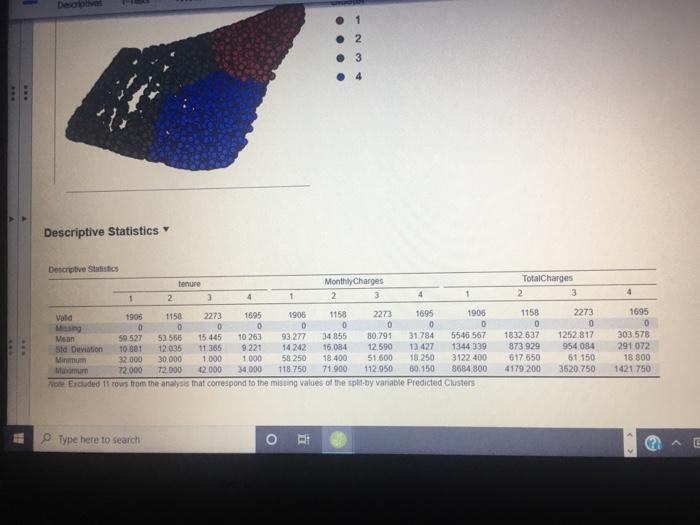
Descriptive Statistics
Descriptive Statistics | |||||||||||||||||||||||||
tenure | MonthlyCharges | TotalCharges | |||||||||||||||||||||||
| 1 | 2 | 3 | 4 | 1 | 2 | 3 | 4 | 1 | 2 | 3 | 4 | |||||||||||||
Valid | 1906 | 1158 | 2273 | 1695 | 1906 | 1158 | 2273 | 1695 | 1906 | 1158 | 2273 | 1695 | |||||||||||||
Missing | 0 | 0 | 0 | 0 | 0 | 0 | 0 | 0 | 0 | 0 | 0 | 0 | |||||||||||||
Mean | 59.527 | 53.566 | 15.445 | 10.263 | 93.277 | 34.855 | 80.791 | 31.784 | 5546.567 | 1832.637 | 1252.817 | 303.578 | |||||||||||||
Std. Deviation | 10.881 | 12.035 | 11.365 | 9.221 | 14.242 | 16.084 | 12.590 | 13.427 | 1344.339 | 873.929 | 954.084 | 291.072 | |||||||||||||
Minimum | 32.000 | 30.000 | 1.000 | 1.000 | 58.250 | 18.400 | 51.600 | 18.250 | 3122.400 | 617.650 | 61.150 | 18.800 | |||||||||||||
Maximum | 72.000 | 72.000 | 42.000 | 34.000 | 118.750 | 71.900 | 112.950 | 60.150 | 8684.800 | 4179.200 | 3520.750 | 1421.750 | |||||||||||||
| |||||||||||||||||||||||||
Step by Step Solution
There are 3 Steps involved in it

Get step-by-step solutions from verified subject matter experts