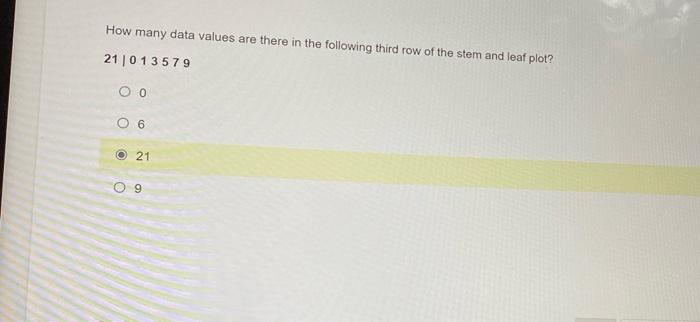
Question: How many data values are there in the following third row of the stem and leaf plot? 21013579 0 0 06 O 21 O 9

How many data values are there in the following
How many data values are there in the following third row of the stem and leaf plot? 21013579 0 0 06 O 21 O 9 Which Greek capital letter indicates the operation of adding? OX o 54 so 69 52 52 The table below shows the frequency distribution for house prices in Richmond, What is the range of the selling prices? POSSIBLE Frequency 10 List Price (s thousands) $0 to under $300 $300 to under $600 $600 to under $900 $900 to under $1200 $1200 to under $1500 8 9 5 8 1200 300 G 46 47 48 49 50 51 5 600 1500 510 The table below shows the frequency distribution for house prices in Richmond. What is the range of the selling prices? POSSIBLE PE List Price (s thousands) $0 to under $300 Frequency 10 8 8 $300 to under $600 $600 to under $900 $900 to under $1200 $1200 to under $1500 9 5 8 o 1200 300 hy 600 1500 48 of 10 001 POSSIBLE POINTS 167 The numbers of chocolate drinks sold at Sara's Coco shop for a sample of days in July 2015 were 30, 50, 60, 70, 80 and 100. The absoluto deviation Ix - is 110. Determine the mean deviation using the formula shown below M 0 212 15.9 11.4 18:3 OF DU Frequency distribution of anticipated annual earnings (in thousands of dollars) of a sample of 92 undergraduate students is shown. Find the mean POSSIBLE POINTS Anticipated earnings Frequency 0-20 30 20-30 27 30-40 14 40-60 19 60-80 2 Total 92 92 O 77.27 27.772 25.55 Calculate N for the following table of grouped data represents the weights (in pounds) of babies born at a local hospital last year, PC Weight (in pounds) Number of babies 3-5 8 5-7 25 7-9 45 9 - 11 18 11 - 13 4 O 45 O 100 18 13 The table below shows the frequency distribution for 85 house prices in Vancouver Calculate the missing frequency POS List Price ($ thousands) $0 to under $300 Frequency $300 to under $600 25 $600 to under $900 24 $900 to under $1200 8 $1200 to under $1500 5 $1500 to under $1800 772 6 $1800 to under $2100 6 O 100 11 085 Find the range 8.3 9.6 9.5 9.1 8.8 11.2 7.7 10.1 9.9 10.8 10.2 8.0 8.4 8.1 11.6 9.6 8.8 8.0 10.4 9.8 9.2 O 7.7 11.6 3.9 O 9.2 The table shows credit hours for fifteen University of Regina undergraduate students. Calculate the mean POSS f 3 1 9 3 12 4 14 1 15 4 17 2 Total 15 14.2 O 15 G 186 12.4

Step by Step Solution

There are 3 Steps involved in it

1 Expert Approved Answer
Step: 1 Unlock blur-text-image
Question Has Been Solved by an Expert!

Get step-by-step solutions from verified subject matter experts

Step: 2 Unlock
Step: 3 Unlock

Students Have Also Explored These Related General Management Questions!