Question: How much value do you believe would be created if Magna successfully unwinds its dual-class structure? How would you propose to divide this value between
How much value do you believe would be created if Magna successfully unwinds its dual-class structure? How would you propose to divide this value between Magna's Class A and B shareholders, i.e., how much would you propose to offer Mr. Stronach per Class B share?
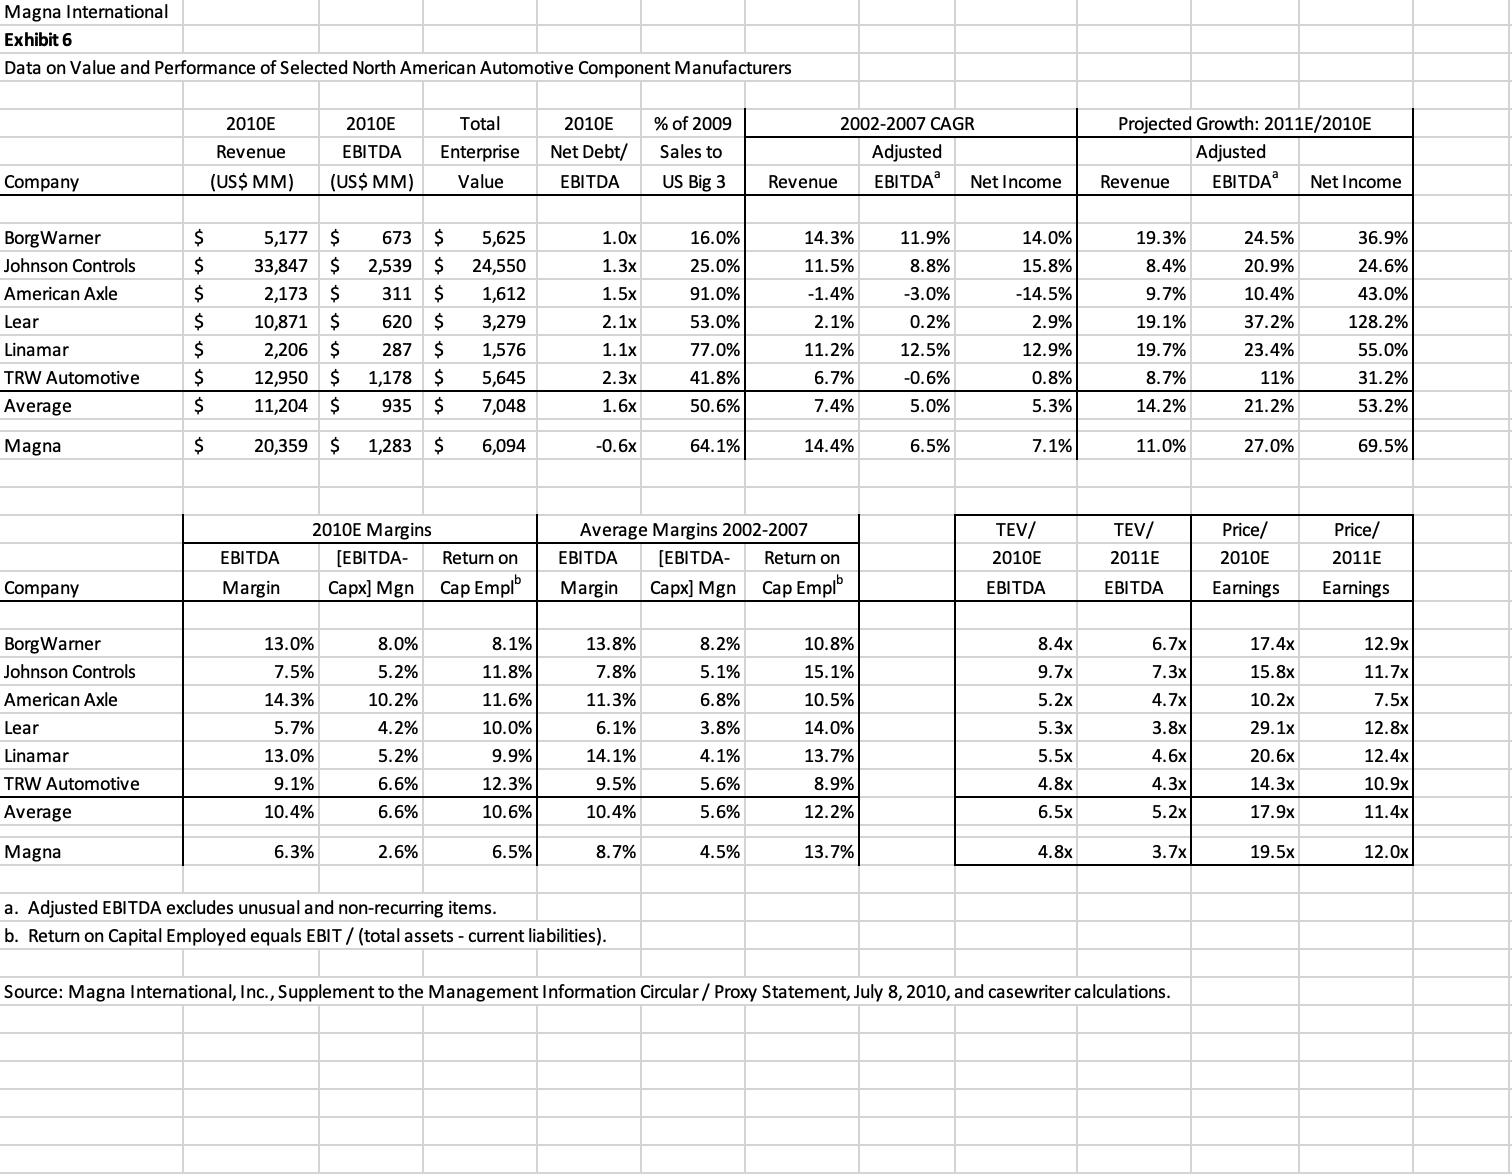
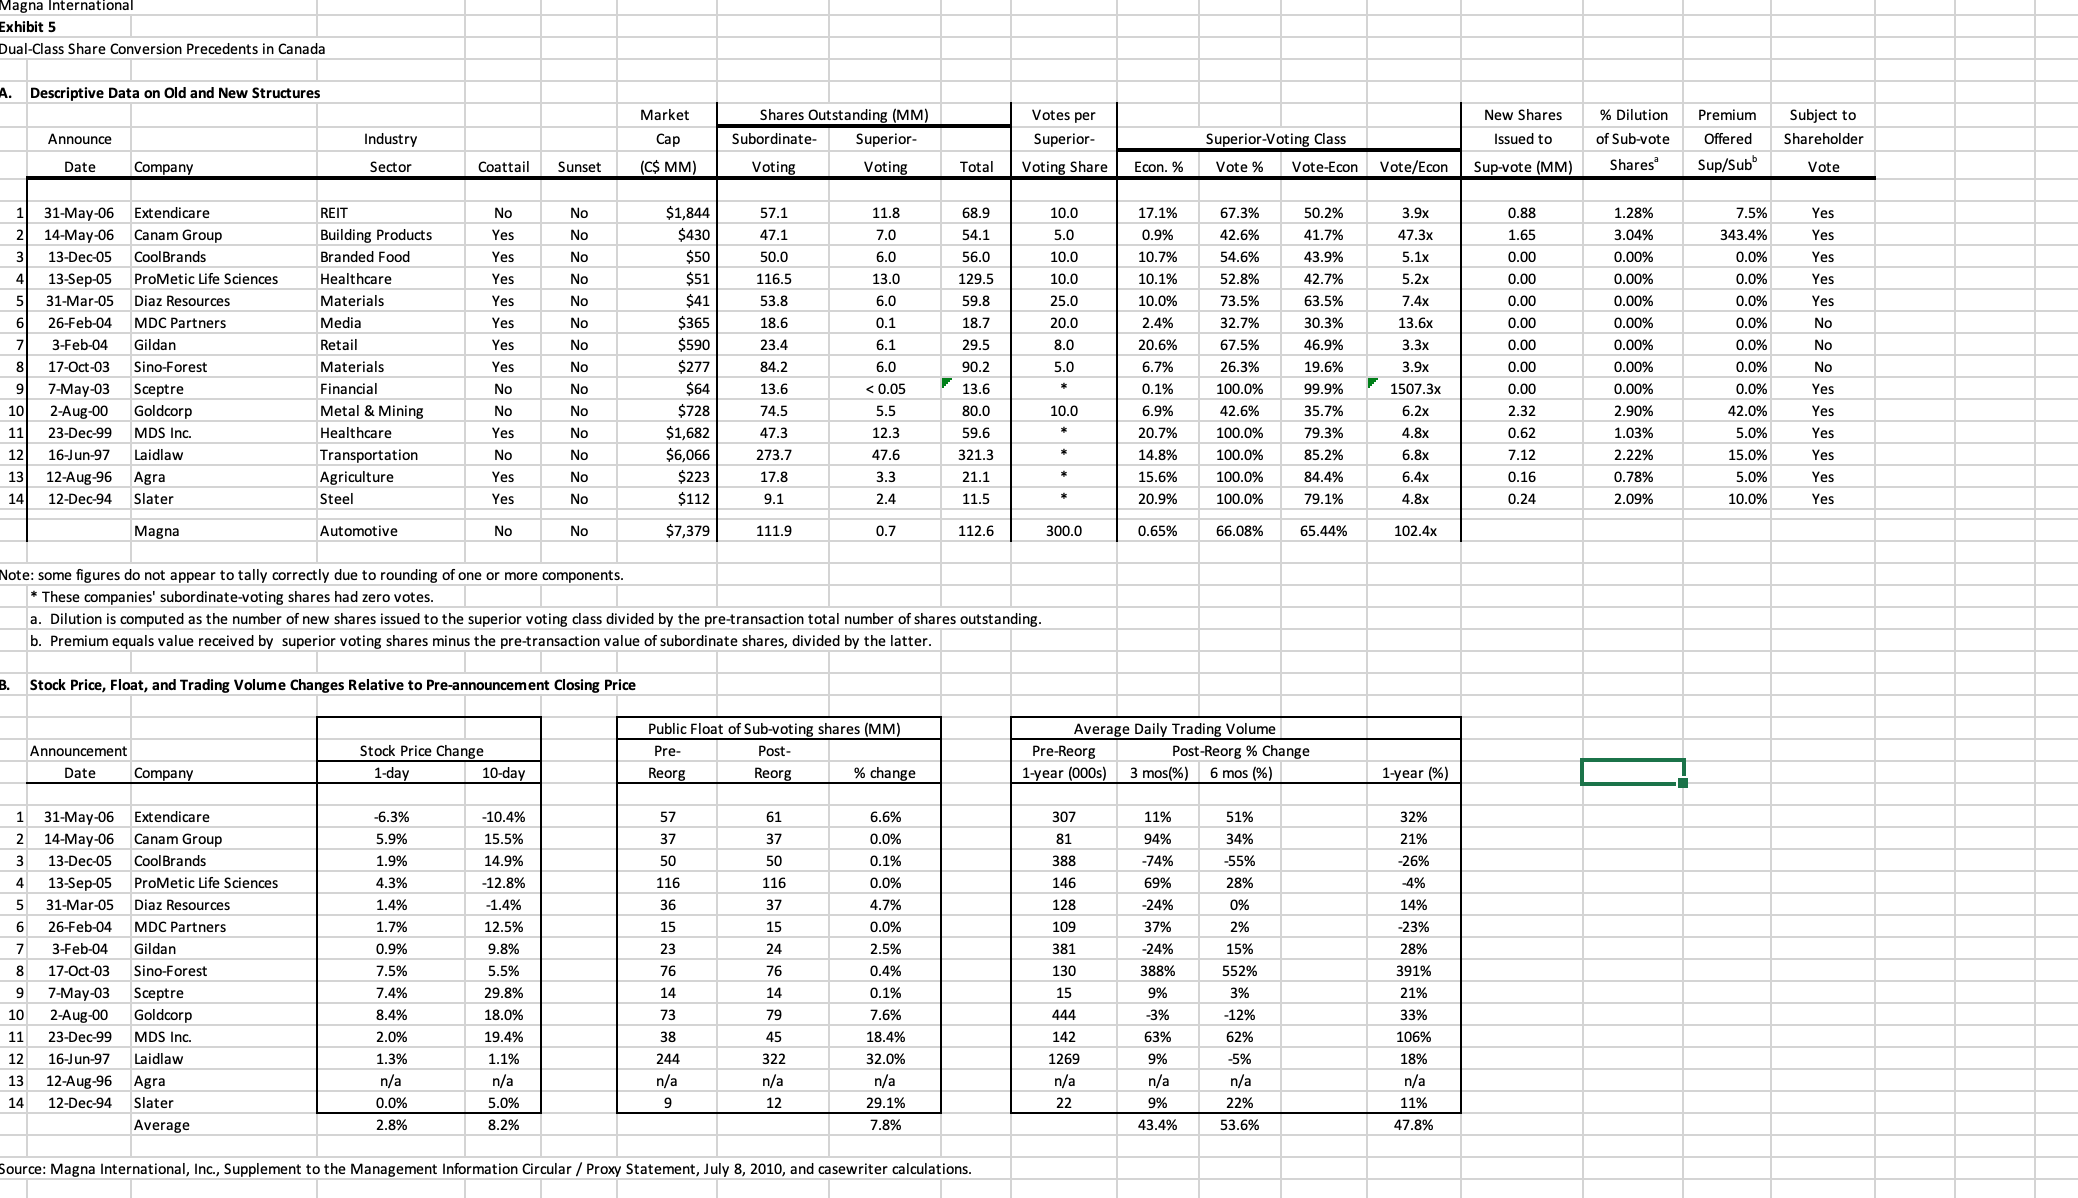
Hint: There are multiple factors to consider, some more relevant than others. These factors include: 1) Magna Class B share trading prices and transactions (page 5), 2) precedent unification transactions (Exhibit 3A), and 3) the value unlocked by eliminating the dual-class structure (Exhibits 3B, 4, and 5). Choose a factor that you believe is the most relevant and appropriate and perform your analysis.
Magna International Exhibit 6 Data on Value and Performance of Selected North American Automotive Component Manufacturers 2010E 2010E Total 2010E % of 2009 2002-2007 CAGR Projected Growth: 20118/2010E Revenue EBITDA Enterprise Net Debt/ Sales to Adjusted Adjusted US$ MM) (US$ MM) Value EBITDA US Big 3 Revenue EBITDA Net Income Revenue EBITDA Net Income Company 5,177 $ 673 $ 5,625 1.0x 16.0% 14.3% 11.9% 14.0% 19.3% 24.5% 36.9% Borg Warner 2,539 $ 24,550 1.3x 25.0% 11.5% 8.8% 15.8% 8.4% 20.9% 24.6% Johnson Controls 33,847 $ 2,173 $ 311 1,612 1.5x 91.0% -1.4% -3.0% -14.5% 9.7% 10.4% 43.0% American Axle 10,871 $ 620 $ 3,279 2.1x 53.0% 2.1% 0.2% 2.9% 19.1% 37.2% 128.2% Lea 2,206 287 $ 1,576 1.1x 11.2% 12.5% 12.9% 19.7% 23.4% 55.0% Linamar 77.0% TRW Automotive 12,950 S 1,178 S 5,645 2.3x 41.8% 6.7% -0.6% .8% 8.7% 11% 31.2% Average 11,204 $ 935 $ 7,048 1.6x 50.6% 7.4% 5.0% 5.3% 14.2% 21.2% 53.2% Magna 20,359 $ 1,283 $ 6,094 -0.6x 64.1% 14.4% 6.5% 7.1% 11.0% 27.0% 69.5% 2010E Margins Average Margins 2002-2007 TEV/ TEV/ Price/ Price EBITDA [EBITDA- Return on 2010E 2011E 2010E 2011E EBITDA [EBITDA- Return on Company Margin Capx] Mgn Cap Empl Margin Capx] Mgn Cap Empl EBITDA EBITDA Earnings Earnings 13.0% 8.0% 8.1% 13.8% 8.2% 10.8% 8.4x 6.7x 17.4x 12.9 Borg Warner Johnson Controls 7.5% 5.2% 11.8% 7.8% 5.1% 15.1% 9.7x 7.3x 15.8x 11.7x American Axle 14.3% 10.2% 11.6% 11.3% 6.8% 10.5% 5.2x 4.7x 10.2x 7.5x Lear 5.7% 4.2% 10.0% 6.1% 3.8% 14.0% 5.3x 3.8x 29.1x 12.8x 9.9% 14.1% 4.1% 13.7% 5.5x 4.6x 20.6x 12.4x Linamar 13.0% 5.2% TRW Automotive 9.1% 6.6% 12.3% 9.5% 5.6% 8.9% 4.8x 4.3x 14.3x 10.9x 10.4% 6.6% 10.6% 10.4% 5.6% 12.2% 5.5X 5.2x 17.9x 11.4x Average 8.7% 4.5% 13.7% 4.8x 3.7x 19.5x 12.0x Magna 6.3% 2.6% 6.5% a. Adjusted EBITDA excludes unusual and non-recurring items. b. Return on Capital Employed equals EBIT / (total assets - current liabilities). Source: Magna International, Inc., Supplement to the Management Information Circular / Proxy Statement, July 8, 2010, and casewriter calculations.Magna International Exhibit 5 Dual-Class Share Conversion Precedents in Canada Descriptive Data on Old and New Structures Votes per New Shares % Dilution Premium Subject to Market Shares Outstanding (MM) Issued to of Sub-vote Offered Shareholder Industry Cap Subordinate- Superior- Superior- Superior-Voting Class Announce Shares Sup/Sub Vote Coattail Sunset (C$ MM) Voting Voting Total Voting Share Econ. % Vote % Vote-Econ Vote/Econ Sup-vote (MM) Date Company Sector 68.9 10.0 17.1% 67.3% 50.2% 3.9x 0.88 1.28% 7.5% Yes 31-May-06 Extendicare REIT No N $1,84 57.1 11.8 47.3x 1.65 3.04% 343.4% Yes 14-May-06 Canam Group Building Products Yes No $430 47.1 7.0 54.1 5.0 0.9% 42.6% 41.7% 10.0 10.7% 54.6% 43.9% 5.1x 0.00 0.00% 0.0% Yes Branded Food Yes No $50 50.0 6.0 56.0 13-Dec-05 CoolBrands 129.5 10.0 10.1% 52.8% 42.7% 5.2x 0.00 0.00% 0.0% Yes 13.0 13-Sep-05 ProMetic Life Sciences Healthcare Yes No $51 116.5 7.4x .00 0.00% 0.09 Yes 31-Mar-05 Diaz Resources Materials Yes No $41 53.8 6.0 59.8 25.0 10.0% 73.5% 63.5% No 0.1 18.7 20.0 2.4% 32.7% 30.3% 13.6x 0.00 0.00% 0.0% Media Yes No $365 18.6 26-Feb-04 MDC Partners 46.9% 3.3x .00 0.00% 0.0% No 3-Feb-04 Gildan Retail Yes No $590 23.4 6.1 29.5 8.0 20.6% 67.5% 0.0% No $277 84.2 6.0 90.2 5.0 6.7% 26.3% 19.6% 3.9x 0.00 0.00% 17-Oct-03 Sino-Forest Materials Yes No 19.9% 1507.3x 0.00 0.00% 0.0% Yes 7-May-03 Sceptre Financial No No $64 13.6 :0.05 13.6 0.1% 100.0% 35.7% 6.2x 2.32 2.90% 42.0% Yes 2-Aug-00 Goldcorp Metal & Mining No No $728 74.5 5.5 80.0 10.0 6.9% 42.6% 12.3 59.6 20.7% 100.0% 79.3% 4.8x 0.62 1.03% 5.0% Yes Yes 47.3 23-Dec-99 MDS Inc. Healthcare No $1,682 15.0% Yes No No $6,066 273.7 47.6 321.3 4.8% 100.0% 85.2% 6.8x 7.12 2.22% 12 16-Jun-97 Laidlaw Transportation Yes $223 17.8 3.3 21.1 15.6% 100.0% 84.4% 6.4x 0.16 0.78% 5.0% 13 12-Aug-96 Agra Agriculture Yes No Yes 9.1 11.5 79.1% $112 2.4 0.9% 100.0% 4.8x 0.24 2.09% 10.0% 14 12-Dec-94 Slater Steel Yes No 66.08% 65.44% 102.4x Automotive No No $7,379 111.9 0.7 112.6 300.0 0.65% Magna Note: some figures do not appear to tally correctly due to rounding of one or more components. *These companies' subordinate-voting shares had zero votes. a. Dilution is computed as the number of new shares issued to the superior voting class divided by the pre-transaction total number of shares outstanding. b. Premium equals value received by superior voting shares minus the pre-transaction value of subordinate shares, divided by the latter. Stock Price, Float, and Trading Volume Changes Relative to Pre-announcement Closing Price Public Float of Sub-voting shares (MM) Average Daily Trading Volume Stock Price Change Pre- Post- Pre-Reorg Post-Reorg % Change Announcement 3 mos(%) 6 mos (%) 1-year (%) Date Company 1-day 10-day Reorg Reorg % change 1-year (000s) 6.6% 307 11% 51% 32% 31-May-06 Extendicare 6.3% -10.4% 57 61 37 37 0.0% 81 94% 34% 21% 14-May-06 Canam Group 5.9% 15.5% 0.1% -74% -26% 50 388 -55% 13-Dec-05 CoolBrands 1.9% 14.9% 50 4% 4.3% -12.8% 116 116 0.0% 146 69% 28% 13-Sep-05 ProMetic Life Sciences 36 37 4.7% 128 -24% 0% 14% 31-Mar-05 Diaz Resources 1.4% -1.4% 15 15 0.0% 109 37% 2% 23% 6 26-Feb-04 MDC Partners 1.7% 12.5% 9.8% 23 24 2.5% 381 -24% 15% 28% 3-Feb-04 Gildan 0.9% 130 388% 552% 391% 8 17-Oct-03 Sino-Forest 7.5% 5.5% 76 76 0.4% 7.4% 29.8% 14 14 0.1% 15 9% 3% 21% 9 7-May-03 Sceptre 8.4% 18.0% 73 79 7.6% 444 -3% -12% 33% 10 2-Aug-00 Goldcorp 142 63% 62% 106% 11 23-Dec-99 MDS Inc. 2.0% 19.4% 38 45 18.4% 18% 244 322 32.09 1269 9% 5% 12 16-Jun-97 Laidlaw 1.3% 1.1% n/a n/a n/a n/a n/a n/a n/a n/a n/a 13 12-Aug-96 Agra 12 29.1% 22 9% 22% 11% 14 12-Dec-94 Slater 0.0% 5.0% 43.4% 53.6% 47.8% Average 2.8% 8.2% 7.8% Source: Magna International, Inc., Supplement to the Management Information Circular / Proxy Statement, July 8, 2010, and casewriter calculations