

Question: how to answer this question Consider the following graph below. Is it misleading? Why or why not? Gas Prices 2.6 2.58 256 2.54 252 2.5
how to answer this question
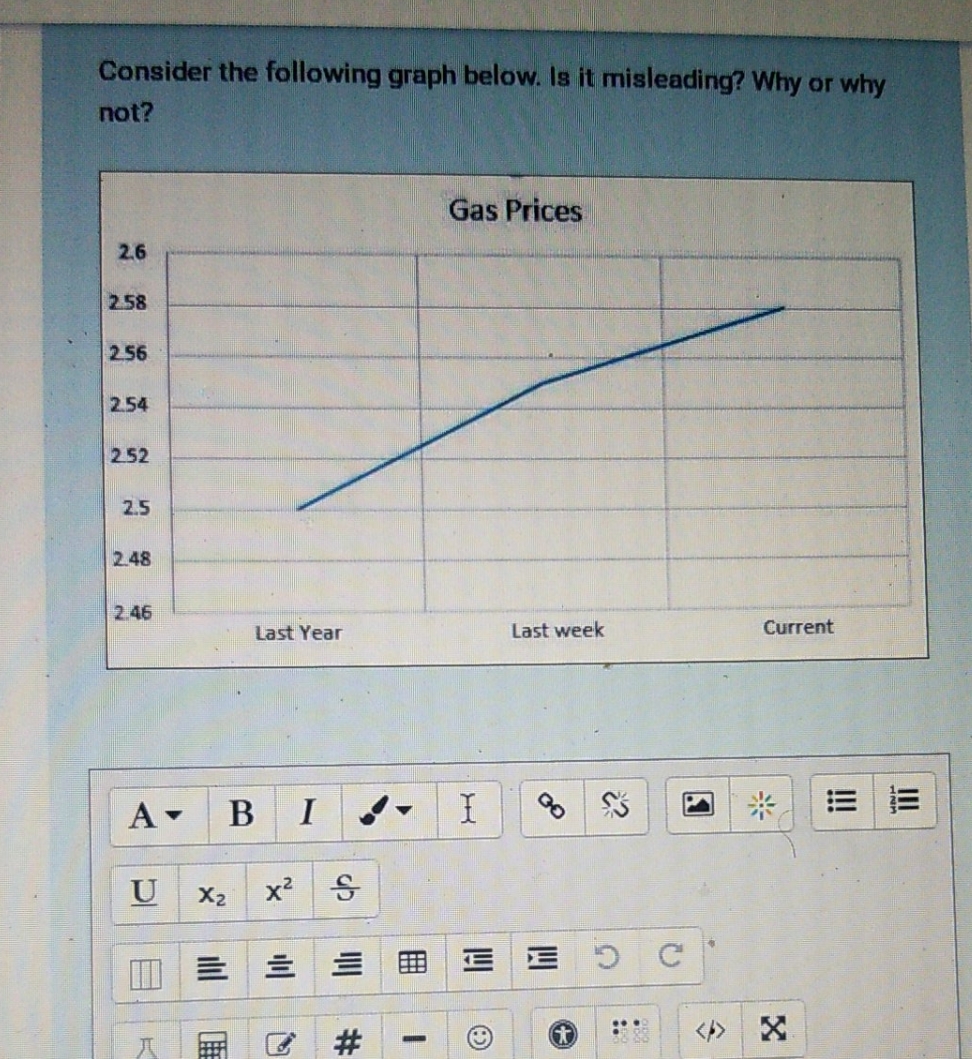
Consider the following graph below. Is it misleading? Why or why not? Gas Prices 2.6 2.58 256 2.54 252 2.5 2.48 2.46 Last Year Last week Current A v B Go S'S U X2 x 2 S E EOC > X
Step by Step Solution
There are 3 Steps involved in it
1 Expert Approved Answer
Step: 1 Unlock

Question Has Been Solved by an Expert!
Get step-by-step solutions from verified subject matter experts
Step: 2 Unlock
Step: 3 Unlock