

Question: You will be given questions about five different clients. Determine the appropriate required minimum distribution as requested. You will need to use one of three
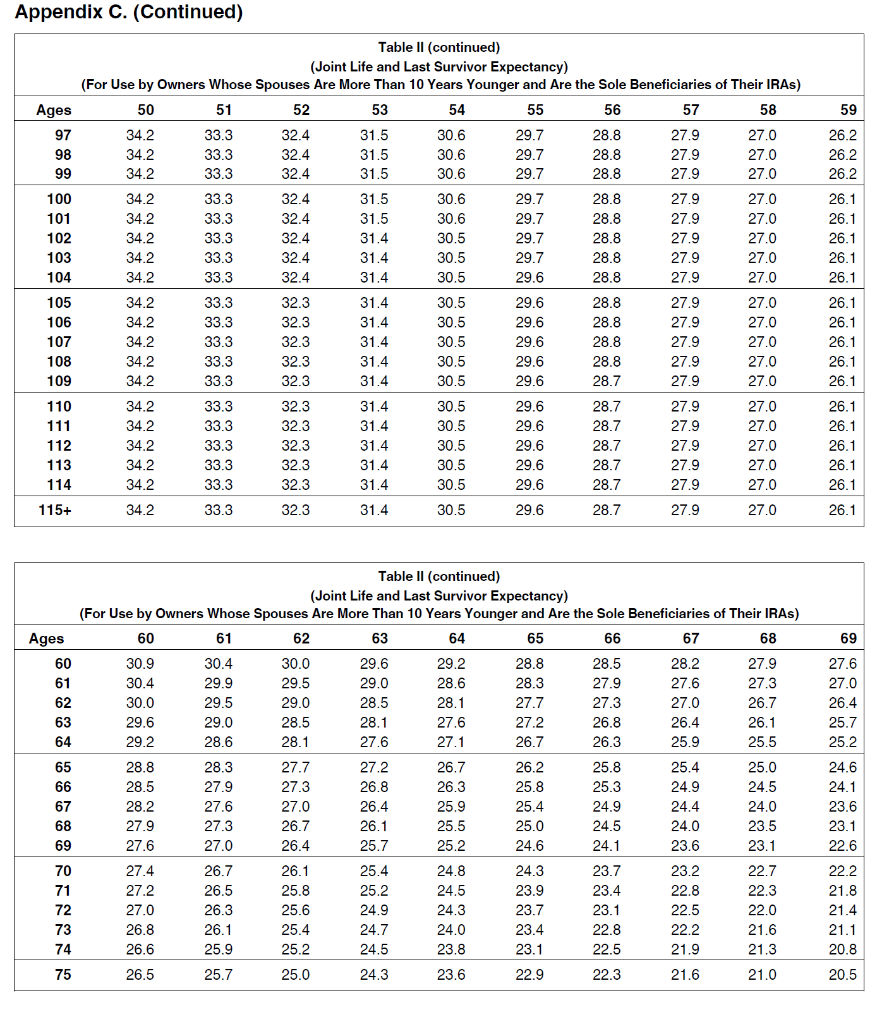
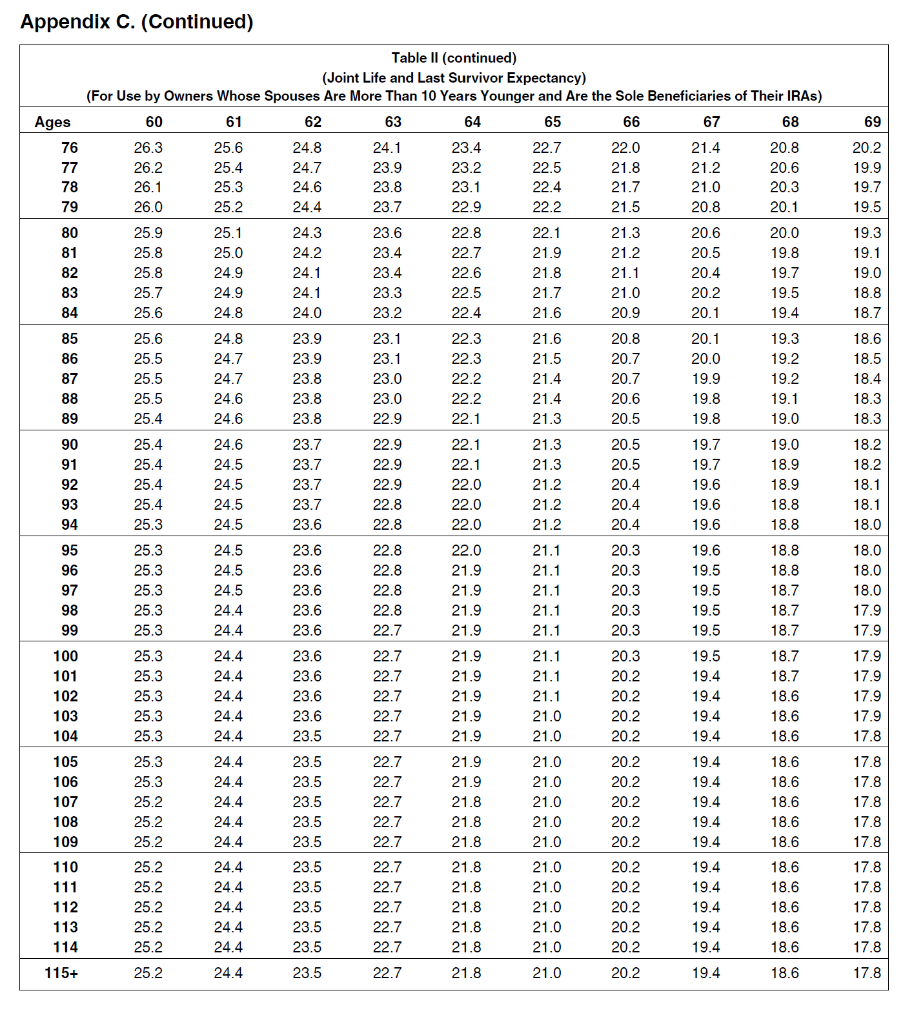
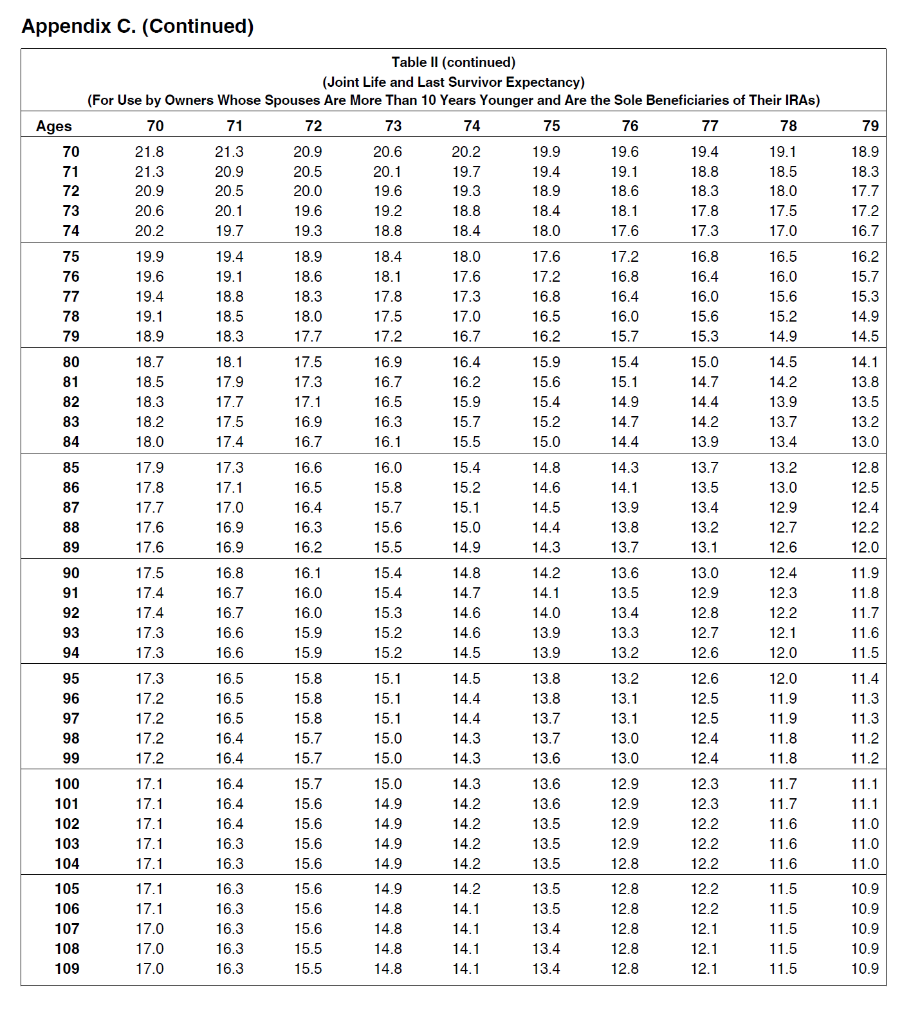
You will be given questions about five different clients. Determine the appropriate required minimum distribution as requested. You will need to use one of three different government tables in your calculations. All three tables come from IRS Publication 590 which governs IRA accounts. You need to download these tables before you take this quiz because you will not have access to them otherwise.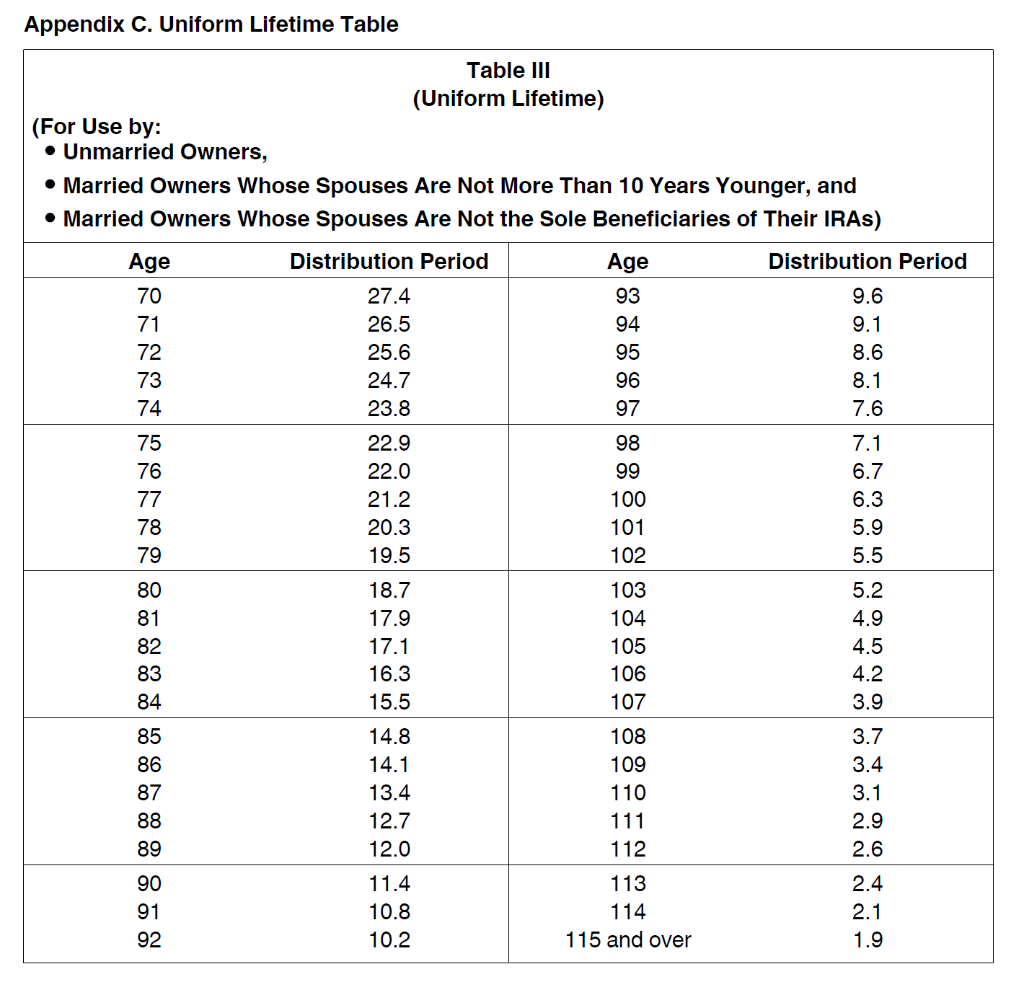
Your first client is a retired mid-level manager from a plastics company. He is 75 years old and his IRA was worth $853,198.47 on December 31st of last year and the current value is $836,072.21. His wife turns 72 years old next month. What is this clients RMD amount for the current tax year? Round your answer to the nearest dollar amount.
Your second client is a retired mortgage loan originator. She is 73 years old. Her second husband is 62 years old. Her IRA was worth $1,021,481.03 on December 31st of last year, but it is currently worth $1,414,841.87. What is this clients RMD amount for the current tax year? Round your answer to the nearest dollar amount.
Your third client just celebrated his 70th birthday in February. He recently sold the Subway that he owned for 30 years. His wife is two years older than he is. His IRA was worth $1,998,075.74 on December 31st of last year, but it is worth $2,384,835.66 now. What is his RMD amount for the current tax year? Round your answer to the nearest dollar amount.
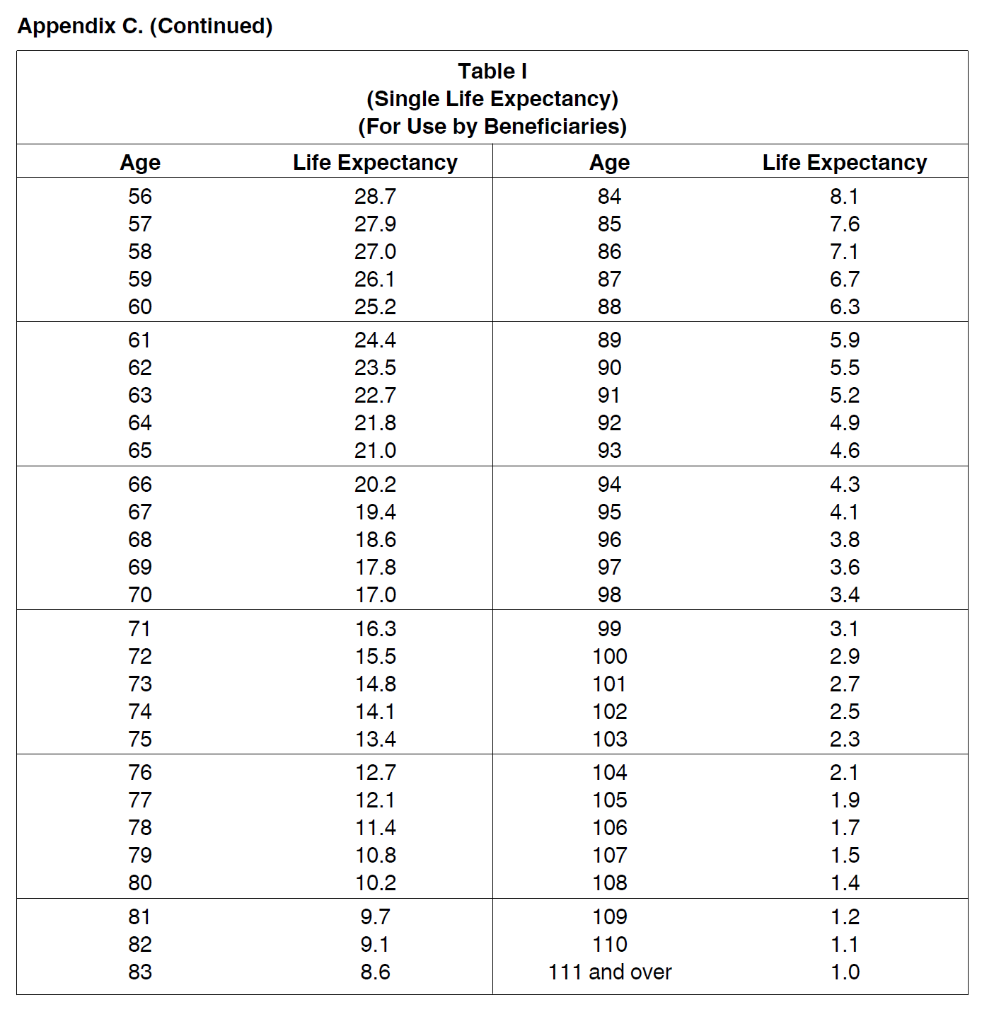
Your fourth client is the child of a recently deceased manufacturing sales rep. She is 35 years old (in the year following her dads death). When she inherited the IRA, it was worth $211,777.78, but the value at the end of the year of death was $190,918.72. Her father was 57 when he passed away. What is this clients RMD amount? Round your answer to the nearest dollar amount.
Your fifth client is the child of a recently deceased municipal supervisor. The child is 41 and his mom, whose account he has inherited, was 72 when she passed away. She died in January. The deceased parent had not taken any distributions out of the account for the year in which she passed away, although she had taken her RMD in the year before she passed. The total account balance on the previous December 31st was $467,336.9. This client will inherit their deceased parents IRA which is now valued at $483,296.23. What is the relevant RMD, at the estate level, in the current year? Round your answer to the nearest dollar amount.
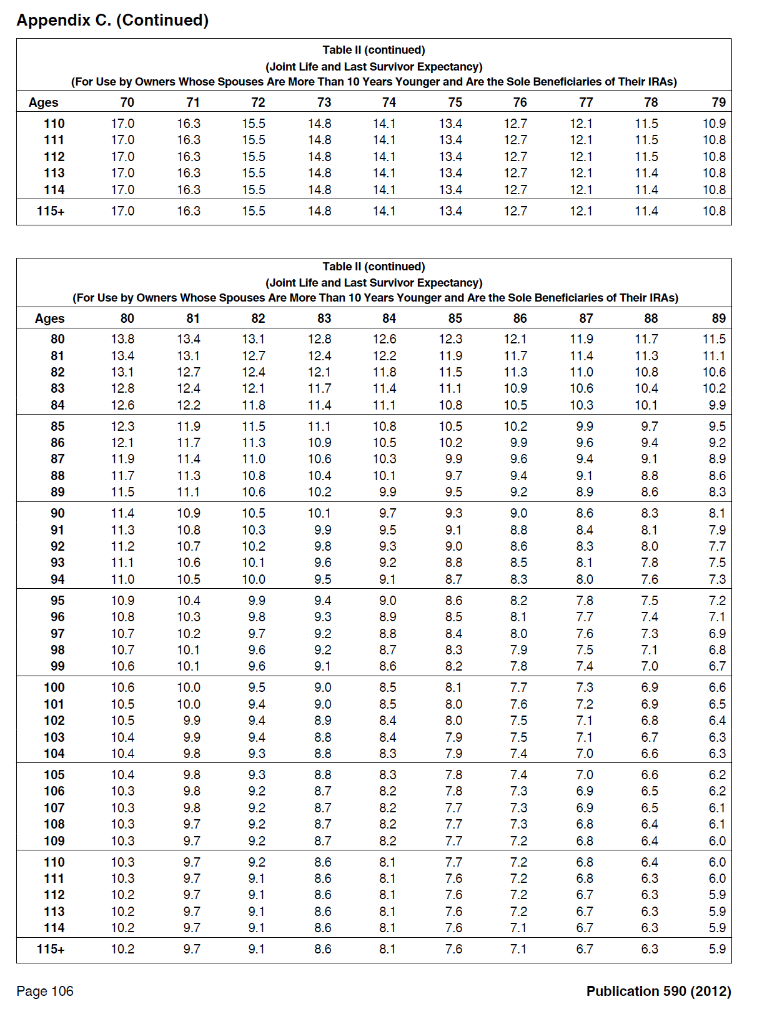
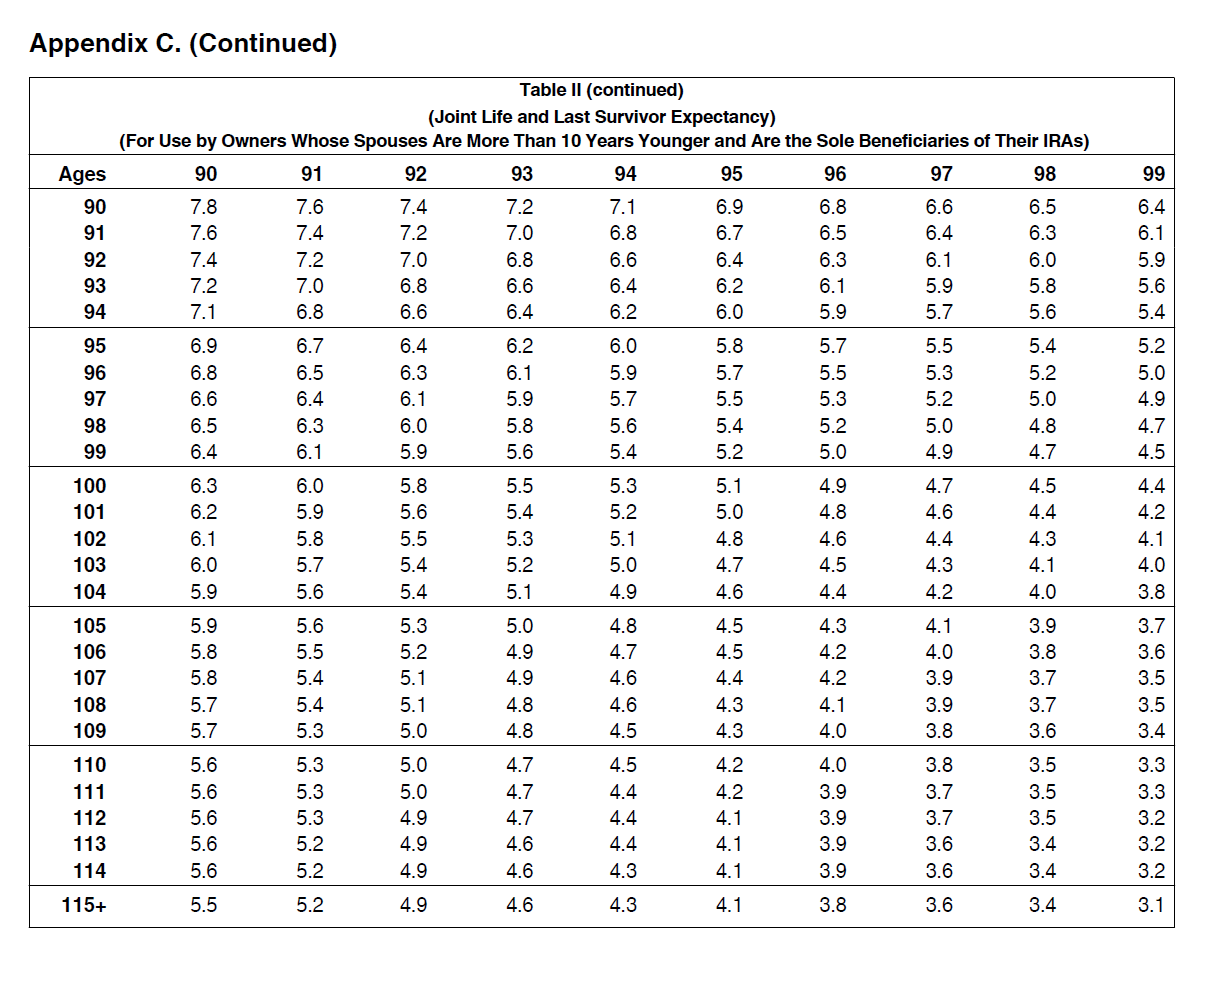
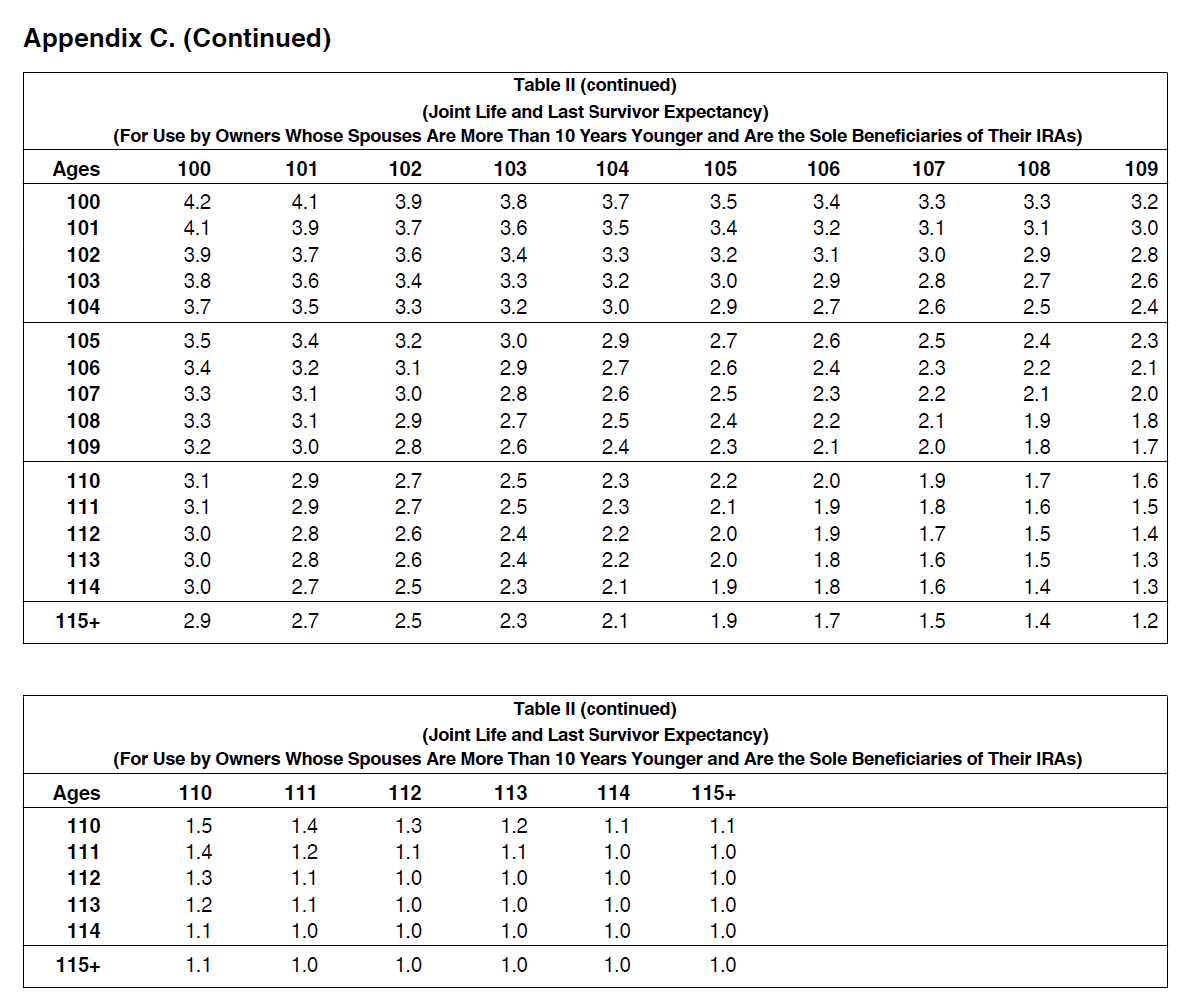
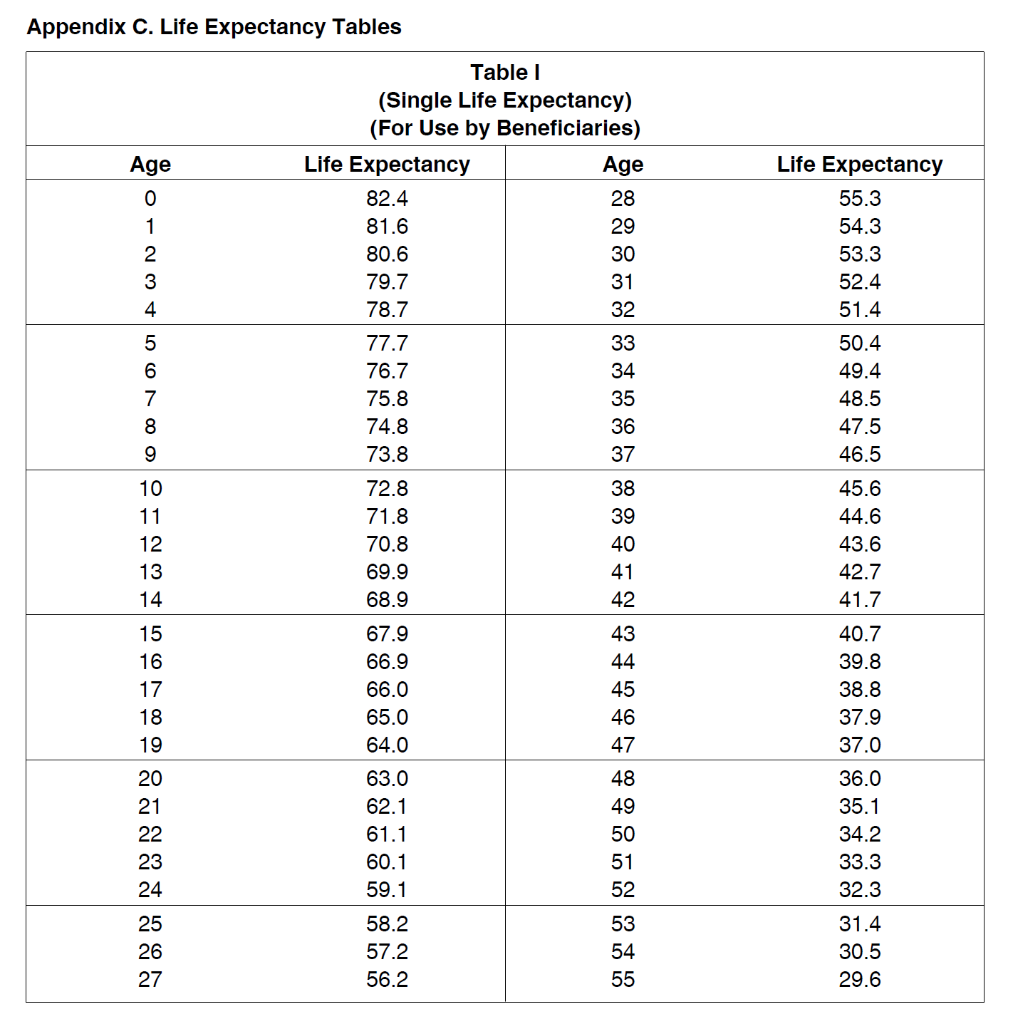
Appendix C. Uniform Lifetime Table 72 Table III (Uniform Lifetime) (For Use by: Unmarried Owners, Married Owners Whose Spouses Are Not More Than 10 Years Younger, and Married Owners Whose Spouses Are Not the Sole Beneficiaries of Their IRAS) Age Distribution Period Age Distribution Period 70 27.4 93 9.6 71 26.5 94 9.1 25.6 95 8.6 73 24.7 96 8.1 74 23.8 97 7.6 75 22.9 98 7.1 76 22.0 99 6.7 77 21.2 100 6.3 78 20.3 101 5.9 79 19.5 102 5.5 80 18.7 103 5.2 81 17.9 104 4.9 82 17.1 105 4.5 83 16.3 106 4.2 84 15.5 3.9 85 14.8 108 3.7 86 14.1 3.4 87 13.4 110 3.1 88 12.7 2.9 89 12.0 112 2.6 90 11.4 113 2.4 91 10.8 114 2.1 92 10.2 115 and over 1.9 107 109 111 Appendix C. (Continued) 59 Ages 97 98 99 100 101 102 103 104 Table II (continued) (Joint Life and Last Survivor Expectancy) (For Use by Owners Whose Spouses Are More Than 10 Years Younger and Are the Sole Beneficiaries of Their IRAs) 50 51 52 53 54 55 56 57 58 34.2 33.3 32.4 31.5 30.6 29.7 28.8 27.9 27.0 34.2 33.3 32.4 31.5 30.6 29.7 28.8 27.9 27.0 34.2 33.3 32.4 31.5 30.6 29.7 28.8 27.9 27.0 34.2 33.3 32.4 31.5 30.6 29.7 28.8 27.9 27.0 34.2 33.3 32.4 31.5 30.6 29.7 28.8 27.9 27.0 34.2 33.3 32.4 31.4 30.5 29.7 28.8 27.9 27.0 34.2 33.3 32.4 31.4 30.5 29.7 28.8 27.9 27.0 34.2 33.3 32.4 31.4 30.5 29.6 28.8 27.9 27.0 34.2 33.3 32.3 31.4 30.5 29.6 28.8 27.9 27.0 34.2 33.3 32.3 31.4 30.5 29.6 28.8 27.9 27.0 34.2 33.3 32.3 31.4 30.5 29.6 28.8 27.9 27.0 34.2 33.3 32.3 31.4 30.5 29.6 28.8 27.9 27.0 34.2 33.3 32.3 31.4 30.5 29.6 28.7 27.9 27.0 34.2 33.3 32.3 31.4 30.5 29.6 28.7 27.9 27.0 34.2 33.3 32.3 31.4 30.5 29.6 28.7 27.9 27.0 34.2 33.3 32.3 31.4 30.5 29.6 28.7 27.9 27.0 34.2 33.3 32.3 31.4 30.5 29.6 28.7 27.9 27.0 34.2 33.3 32.3 31.4 30.5 27.9 27.0 34.2 33.3 32.3 31.4 30.5 29.6 28.7 27.9 27.0 26.2 26.2 26.2 26.1 26.1 26.1 26.1 26.1 105 106 107 108 109 26.1 26.1 26.1 26.1 26.1 110 111 112 113 114 26.1 26.1 26.1 26.1 26.1 29.6 28.7 115+ 26.1 Ages 69 60 61 62 63 64 27.6 27.0 26.4 25.7 25.2 65 66 Table II (continued) (Joint Life and Last Survivor Expectancy) (For Use by Owners Whose Spouses Are More Than 10 Years Younger and Are the Sole Beneficiaries of Their IRAs) 60 61 62 63 64 65 66 67 68 30.9 30.4 30.0 29.6 29.2 28.8 28.5 28.2 27.9 30.4 29.9 29.5 29.0 28.6 28.3 27.9 27.6 27.3 30.0 29.5 29.0 28.5 28.1 27.7 27.3 27.0 26.7 29.6 29.0 28.5 28.1 27.6 27.2 26.8 26.4 26.1 29.2 28.6 28.1 27.6 27.1 26.7 26.3 25.9 25.5 28.8 28.3 27.7 27.2 26.7 26.2 25.8 25.4 25.0 28.5 27.9 27.3 26.8 26.3 25.8 25.3 24.9 24.5 28.2 27.6 27.0 26.4 25.9 25.4 24.9 24.4 24.0 27.9 27.3 26.7 26.1 25.5 25.0 24.5 24.0 23.5 27.6 27.0 26.4 25.7 25.2 24.6 24.1 23.6 23.1 27.4 26.7 26.1 25.4 24.8 24.3 23.7 23.2 22.7 27.2 26.5 25.8 25.2 24.5 23.9 23.4 22.8 22.3 27.0 26.3 25.6 24.9 24.3 23.7 23.1 22.5 22.0 26.8 26.1 25.4 24.7 24.0 23.4 22.8 22.2 21.6 26.6 25.9 25.2 24.5 23.8 23.1 22.5 21.9 21.3 26.5 25.7 25.0 24.3 23.6 22.9 22.3 21.6 21.0 67 68 69 24.6 24.1 23.6 23.1 22.6 22.2 21.8 21.4 21.1 20.8 70 71 72 73 74 75 20.5 Appendix C. (Continued) Ages 69 76 77 78 79 20.2 19.9 19.7 19.5 20.6 80 81 82 83 84 24.1 23.4 21.8 19.3 19.1 19.0 18.8 18.7 85 86 87 88 89 18.6 18.5 18.4 18.3 18.3 90 25.4 23.7 22.9 91 92 93 94 Table II (continued) (Joint Life and Last Survivor Expectancy) (For Use by Owners Whose Spouses Are More Than 10 Years Younger and Are the Sole Beneficiaries of Their IRAs) 60 61 62 63 64 65 66 67 68 26.3 25.6 24.8 24.1 23.4 22.7 22.0 21.4 20.8 26.2 25.4 24.7 23.9 23.2 22.5 21.8 21.2 20.6 26.1 25.3 24.6 23.8 23.1 22.4 21.7 21.0 20.3 26.0 25.2 24.4 23.7 22.9 22.2 21.5 20.8 20.1 25.9 25.1 24.3 23.6 22.8 22.1 21.3 20.0 25.8 25.0 24.2 23.4 22.7 21.9 21.2 20.5 19.8 25.8 24.9 22.6 21.1 20.4 19.7 25.7 24.9 24.1 23.3 22.5 21.7 21.0 20.2 19.5 25.6 24.8 24.0 23.2 22.4 21.6 20.9 20.1 19.4 25.6 24.8 23.9 23.1 22.3 21.6 20.8 20.1 19.3 25.5 24.7 23.9 23.1 22.3 21.5 20.7 20.0 19.2 25.5 24.7 23.8 23.0 22.2 21.4 20.7 19.9 19.2 25.5 24.6 23.8 23.0 22.2 21.4 20.6 19.8 19.1 25.4 24.6 23.8 22.9 22.1 21.3 20.5 19.8 19.0 25.4 24.6 23.7 22.9 22.1 21.3 20.5 19.7 19.0 25.4 24.5 23.7 22.9 22.1 21.3 20.5 19.7 18.9 24.5 22.0 21.2 20.4 19.6 18.9 25.4 24.5 23.7 22.8 22.0 21.2 20.4 19.6 18.8 25.3 23.6 22.8 22.0 21.2 20.4 19.6 25.3 24.5 23.6 22.8 22.0 21.1 20.3 19.6 18.8 25.3 24.5 23.6 22.8 21.9 21.1 20.3 19.5 18.8 25.3 24.5 23.6 22.8 21.9 21.1 20.3 19.5 18.7 25.3 24.4 23.6 22.8 21.9 21.1 20.3 19.5 18.7 25.3 24.4 23.6 22.7 21.9 21.1 20.3 19.5 18.7 25.3 24.4 23.6 22.7 21.9 21.1 20.3 19.5 18.7 25.3 24.4 23.6 22.7 21.1 20.2 19.4 18.7 25.3 24.4 23.6 22.7 21.9 21.1 20.2 19.4 18.6 25.3 24.4 23.6 22.7 21.0 20.2 19.4 18.6 25.3 24.4 23.5 22.7 21.9 21.0 20.2 19.4 18.6 25.3 24.4 23.5 22.7 21.9 21.0 20.2 19.4 18.6 25.3 24.4 23.5 22.7 21.9 21.0 20.2 19.4 18.6 25.2 24.4 23.5 22.7 21.8 21.0 20.2 19.4 18.6 25.2 24.4 23.5 22.7 21.8 21.0 20.2 19.4 18.6 25.2 24.4 23.5 22.7 21.8 21.0 20.2 19.4 18.6 25.2 24.4 23.5 22.7 21.8 21.0 20.2 19.4 18.6 25.2 24.4 23.5 22.7 21.8 21.0 20.2 19.4 18.6 25.2 24.4 23.5 22.7 21.8 21.0 20.2 19.4 18.6 25.2 24.4 23.5 22.7 21.8 21.0 20.2 19.4 18.6 25.2 24.4 23.5 22.7 21.8 21.0 20.2 19.4 18.6 25.2 24.4 23.5 22.7 21.8 21.0 20.2 19.4 18.6 24.5 18.8 18.2 18.2 18.1 18.1 18.0 18.0 18.0 18.0 17.9 17.9 95 96 97 98 99 21.9 100 101 102 103 104 17.9 17.9 17.9 17.9 17.8 21.9 105 106 107 108 109 17.8 17.8 17.8 17.8 17.8 110 111 112 113 114 17.8 17.8 17.8 17.8 17.8 115+ 17.8 Appendix C. (Continued) 79 Ages 70 71 72 73 74 18.9 18.3 17.7 17.2 16.7 17.2 16.5 16.2 15.7 75 76 77 78 79 16.4 15.3 14.9 14.5 80 81 82 83 14.1 13.8 13.5 13.2 13.0 84 14.4 85 86 87 88 89 Table II (continued) (Joint Life and Last Survivor Expectancy) (For Use by Owners Whose Spouses Are More Than 10 Years Younger and Are the Sole Beneficiaries of Their IRAs) 70 71 72 73 74 75 76 77 78 21.8 21.3 20.9 20.6 20.2 19.9 19.6 19.4 19.1 21.3 20.9 20.5 20.1 19.7 19.4 19.1 18.8 18.5 20.9 20.5 20.0 19.6 19.3 18.9 18.6 18.3 18.0 20.6 20.1 19.6 19.2 18.8 18.4 18.1 17.8 17.5 20.2 19.7 19.3 18.8 18.4 18.0 17.6 17.3 17.0 19.9 19.4 18.9 18.4 18.0 17.6 16.8 19.6 19.1 18.6 18.1 17.6 17.2 16.8 16.4 16.0 19.4 18.8 18.3 17.8 17.3 16.8 16.0 15.6 19.1 18.5 18.0 17.5 17.0 16.5 16.0 15.6 15.2 18.9 18.3 17.7 17.2 16.7 16.2 15.7 15.3 14.9 18.7 18.1 17.5 16.9 16.4 15.9 15.4 15.0 14.5 18.5 17.9 17.3 16.7 16.2 15.6 15.1 14.7 14.2 18.3 17.7 17.1 16.5 15.9 15.4 14.9 14.4 13.9 18.2 17.5 16.9 16.3 15.7 15.2 14.7 14.2 13.7 18.0 17.4 16.7 16.1 15.5 15.0 13.9 13.4 17.9 17.3 16.6 16.0 15.4 14.8 14.3 13.7 13.2 17.8 17.1 16.5 15.8 15.2 14.6 14.1 13.5 13.0 17.7 17.0 16.4 15.7 15.1 14.5 13.9 13.4 12.9 17.6 16.9 16.3 15.6 15.0 14.4 13.8 13.2 12.7 17.6 16.9 16.2 15.5 14.9 14.3 13.7 13.1 12.6 17.5 16.8 15.4 14.8 14.2 13.6 13.0 12.4 17.4 16.7 16.0 15.4 14.7 14.1 13.5 12.9 12.3 16.7 16.0 15.3 14.6 14.0 12.8 12.2 17.3 16.6 15.9 15.2 14.6 13.9 13.3 12.7 12.1 17.3 16.6 15.9 15.2 14.5 13.9 13.2 12.0 17.3 16.5 15.8 15.1 14.5 13.8 13.2 12.6 12.0 17.2 16.5 15.8 15.1 14.4 13.8 13.1 12.5 11.9 17.2 16.5 15.8 15.1 14.4 13.7 13.1 12.5 11.9 17.2 16.4 15.7 15.0 14.3 13.7 13.0 12.4 11.8 17.2 16.4 15.7 15.0 14.3 13.6 13.0 12.4 11.8 17.1 16.4 15.7 15.0 14.3 13.6 12.9 12.3 11.7 17.1 16.4 15.6 14.9 14.2 13.6 12.9 12.3 17.1 16.4 15.6 14.9 14.2 13.5 12.9 12.2 11.6 17.1 16.3 14.2 13.5 12.2 11.6 17.1 16.3 15.6 14.9 14.2 13.5 12.8 12.2 11.6 17.1 16.3 15.6 14.9 14.2 13.5 12.2 11.5 17.1 16.3 15.6 14.8 14.1 13.5 12.8 12.2 11.5 17.0 16.3 15.6 14.8 14.1 13.4 12.8 12.1 17.0 16.3 15.5 14.8 14.1 13.4 12.8 12.1 11.5 15.5 14.8 14.1 13.4 12.8 12.1 11.5 12.8 12.5 12.4 12.2 12.0 16.1 11.9 90 91 92 93 94 17.4 13.4 12.6 95 96 97 98 99 11.8 11.7 11.6 11.5 11.4 11.3 11.3 11.2 11.2 11.7 11.1 11.1 11.0 11.0 11.0 15.6 14.9 12.9 100 101 102 103 104 105 106 107 108 109 12.8 11.5 10.9 10.9 10.9 10.9 10.9 17.0 16.3 Appendix C. (Continued) Ages 110 111 112 113 114 Table II (continued) (Joint Life and Last Survivor Expectancy) (For Use by Owners Whose Spouses Are More Than 10 Years Younger and Are the Sole Beneficiaries of Their IRAs) 70 71 72 73 74 75 76 77 78 17.0 16.3 15.5 14.8 14.1 13.4 12.7 12.1 11.5 17.0 16.3 15.5 14.8 14.1 13.4 12.7 12.1 11.5 17.0 16.3 15.5 14.8 14.1 13.4 12.7 12.1 11.5 17.0 16.3 15.5 14.8 14.1 13.4 12.7 12.1 11.4 17.0 16.3 15.5 14.8 14.1 13.4 12.7 12.1 11.4 17.0 16.3 15.5 14.8 14.1 13.4 12.7 12.1 11.4 79 10.9 10.8 10.8 10.8 10.8 10.8 115+ 89 Ages 80 81 82 83 84 85 86 87 88 89 11.5 11.1 10.6 10.2 9.9 9.5 9.2 8.9 8.6 8.3 8.1 7.9 7.7 7.5 7.3 7.2 7.1 6.9 6.8 6.7 90 91 92 93 94 Table II (continued) (Joint Life and Last Survivor Expectancy) (For Use by Owners Whose Spouses Are More Than 10 Years Younger and Are the Sole Beneficiaries of Their IRAs) 80 81 82 83 84 85 86 87 88 13.8 13.4 13.1 12.8 12.6 12.3 12.1 11.9 11.7 13.4 13.1 12.7 12.4 12.2 11.9 11.7 11.4 11.3 13.1 12.7 12.4 12.1 11.8 11.5 11.3 11.0 10.8 12.8 12.4 12.1 11.7 11.4 11.1 10.9 10.6 10.4 12.6 12.2 11.8 11.4 11.1 10.8 10.5 10.3 10.1 12.3 11.9 11.5 11.1 10.8 10.5 10.2 9.9 9.7 12.1 11.7 11.3 10.9 10.5 10.2 9.9 9.6 9.4 11.9 11.4 11.0 10.6 10.3 9.9 9.6 9.4 9.1 11.7 11.3 10.8 10.4 10.1 9.7 9.4 9.1 8.8 11.5 11.1 10.6 10.2 9.9 9.5 9.2 8.9 8.6 11.4 10.9 10.5 10.1 9.7 9.3 9.0 8.6 8.3 11.3 10.8 10.3 9.9 9.5 9.1 8.8 8.4 8.1 11.2 10.7 10.2 9.8 9.3 9.0 8.6 8.3 8,0 11.1 10.6 10.1 9.6 9.2 8.8 8.5 8.1 7.8 11.0 10.5 10.0 9.5 9.1 8.7 8.3 8.0 7.6 10.9 10.4 9.9 9.4 9.0 8.6 8.2 7.8 7.5 10.8 10.3 9.8 9.3 8.9 8.5 8.1 7.7 7.4 10.7 10.2 9.7 9.2 8.8 8.4 8.0 7.6 7.3 10.7 10.1 9.6 9.2 8.7 8.3 7.9 7.5 7.1 10.6 10.1 9.1 8.6 8.2 7.8 7.4 7.0 10.6 10.0 9.5 9.0 8.5 8.1 7.7 7.3 6.9 10.5 10.0 9.4 9.0 8.5 8.0 7.6 7.2 6.9 10.5 9.9 9.4 8.9 8.4 8.0 7.5 7.1 6.8 10.4 9.9 9.4 8.8 8.4 7.9 7.5 7.1 6.7 10.4 9.8 9.3 8.8 8.3 7.9 7.4 7.0 6.6 10.4 9.8 9.3 8.8 8.3 7.8 7.4 7.0 6.6 10.3 9.8 9.2 8.7 8.2 7.8 7.3 6.9 6.5 10.3 9.8 9.2 8.7 8.2 7.7 7.3 6.9 6.5 10.3 9.7 9.2 8.7 8.2 7.7 7.3 6.8 6.4 10.3 9.7 9.2 8.7 8.2 7.7 7.2 6.8 6.4 10.3 9.7 9.2 8.6 8.1 7.7 7.2 6.8 6.4 10.3 9.7 9.1 8.6 8.1 7.6 7.2 6.8 6.3 10.2 9.7 9.1 8.6 8.1 7.6 7.2 6.7 6.3 10.2 9.7 9.1 8.6 8.1 7.6 7.2 6.7 6.3 10.2 9.7 9.1 8.6 8.1 7.6 7.1 6.7 6.3 10.2 9.7 9.1 8.6 8.1 7.6 7.1 6.7 6.3 95 96 97 98 99 9.6 100 101 102 103 104 6.6 6.5 6.4 6.3 6.3 6.2 6.2 6.1 6.1 6.0 105 106 107 108 109 110 111 112 113 114 6.0 6.0 5.9 5.9 5.9 115+ 5.9 Page 106 Publication 590 (2012) Appendix C. (Continued) 99 Ages 90 91 92 93 94 7.6 6.4 6.1 5.9 5.6 5.4 95 96 97 98 99 100 101 102 103 104 Tablell (continued) (Joint Life and Last Survivor Expectancy) (For Use by Owners Whose Spouses Are More Than 10 Years Younger and Are the Sole Beneficiaries of Their IRAs) 90 91 92 93 94 95 96 97 98. 7.8 7.6 7.4 7.2 7.1 6.9 6.8 6.6 6.5 7.4 7.2 7.0 6.8 6.7 6.5 7.4 7.2 7.0 6.8 6.6 6.4 6.3 6.1 6.0 7.2 7.0 6.8 6.6 6.4 6.2 6.1 5.9 5.8 7.1 6.8 6.6 6.4 6.2 6.0 5.9 5.7 5.6 6.9 6.7 6.4 6.2 6.0 5.8 5.7 5.4 6.8 6.5 6.3 6.1 5.9 5.7 5.5 5.3 5.2 6.6 6.4 6.1 5.9 5.7 5.5 5.3 5.2 5.0 6.5 6.3 6.0 5.8 5.6 5.4 5.2 5.0 4.8 6.4 6.1 5.9 5.6 5.4 5.2 5.0 4.9 4.7 6.3 6.0 5.8 5.3 5.1 4.9 4.7 6.2 5.9 5.6 5.4 5.2 5.0 4.8 4.6 4.4 6.1 5.8 5.5 5.3 5.1 4.8 4.6 4.4 4.3 6.0 5.7 5.4 5.0 4.7 4.3 4.1 5.9 5.6 5.4 5.1 4.9 4.6 4.4 4.2 4.0 5.9 5.6 5.3 5.0 4.8 4.5 4.3 4.1 3.9 5.8 5.5 5.2 4.9 4.7 4.5 4.2 4.0 3.8 5.8 5.4 5.1 4.9 4.6 4.4 3.9 3.7 5.7 5.4 5.1 4.8 4.6 4.3 4.1 3.9 3.7 5.7 5.3 5.0 4.8 4.5 4.3 4.0 3.8 3.6 5.3 5.0 4.7 4.5 4.2 3.8 3.5 5.6 5.3 5.0 4.7 4.4 4.2 3.9 3.7 3.5 5.6 5.3 4.9 4.7 4.4 4.1 3.9 3.7 3.5 5.6 5.2 4.9 4.6 4.4 4.1 3.9 3.6 3.4 5.6 5.2 4.9 4.6 4.3 4.1 3.9 3.6 3.4 5.5 4.9 4.6 4.3 4.1 3.8 3.6 UNOON | - 0 - - - | 0 0 0 0 1 1 0 0 0 10 9 - 9 - 105 106 4.2 107 108 109 3.7 3.6 3.5 3.5 3.4 110 111 112 3.3 3.3 3.2 3.2 3.2 113 114 115+ 3.4 3.1 Appendix C. (Continued) 109 Ages 100 101 102 103 104 Table II (continued) (Joint Life and Last Survivor Expectancy) (For Use by Owners Whose Spouses Are More Than 10 Years Younger and Are the Sole Beneficiaries of Their IRAS) 100 101 102 103 104 105 106 107 108 4.2 4.1 3.9 3.8 3.7 3.5 3.4 3.3 3.3 4.1 3.9 3.7 3.6 3.5 3.4 3.2 3.1 3.1 3.9 3.7 3.6 3.4 3.3 3.2 3.1 3.0 2.9 3.8 3.6 3.4 3.3 3.2 3.0 2.9 2.7 3.7 3.5 3.3 3.2 3.0 2.9 2.7 2.6 2.5 3.2 3.0 2.8 2.6 2.4 105 106 107 108 109 3.5 3.4 3.3 3.3 3.2 3.4 3.2 3.1 3.1 3.0 3.2 3.1 3.0 2.9 2.8 00 ONA O 3.0 2.9 2.8 2.7 2.6 2.9 2.7 2.6 2.5 2.4 2.7 2.6 2.5 2.4 2.3 2.6 2.4 2.3 2.2 2.1 2.5 2.3 2.2 2.1 2.0 2.4 2.2 2.1 1.9 1.8 2.3 2.1 2.0 1.8 1.7 3.1 3.1 2.5 2.5 110 111 112 113 114 3.0 2.9 2.9 2.8 2.8 2.7 2.7 2.7 2.6 2.6 2.5 2.4 2.3 2.3 2.2 2.2 2.1 2.2 2.1 2.0 2.0 1.9 2.0 1.9 1.9 1.8 1.8 1.9 1.8 1.7 1.6 1.6 1.7 1.6 1.5 1.5 1.4 1.6 1.5 1.4 1.3 1.3 3.0 3.0 2.4 2.3 115+ 2.9 2.7 2.3 2.1 1.9 1.7 1.5 1.4 1.2 Ages 110 Table II (continued) (Joint Life and Last Survivor Expectancy) (For Use by Owners Whose Spouses Are More Than 10 Years Younger and Are the Sole Beneficiaries of Their IRAS) 110 111 112 113 114 115+ 1.5 1.4 1.3 1.2 1.1 1.1 1.4 1.2 1.1 1.1 1.0 1.0 1.3 1.1 1.0 1.0 1.0 1.0 1.2 1.1 1.0 1.0 1.0 1.0 1.1 1.0 1.0 1.0 1.0 1.0 1.1 1.0 1.0 1.0 1.0 1.0 111 112 113 114 115+ Appendix C. Life Expectancy Tables Age Table 1 (Single Life Expectancy) (For Use by Beneficiaries) Life Expectancy Age 82.4 28 81.6 29 80.6 30 79.7 31 78.7 32 1 2 3 Life Expectancy 55.3 54.3 53.3 52.4 51.4 4 5 6 7 8 77.7 76.7 75.8 74.8 73.8 33 34 35 36 37 50.4 49.4 48.5 47.5 46.5 9 10 11 12 13 14 38 39 40 41 42 45.6 44.6 43.6 42.7 41.7 72.8 71.8 70.8 69.9 68.9 67.9 66.9 66.0 65.0 64.0 15 16 17 18 19 43 44 45 46 47 40.7 39.8 38.8 37.9 37.0 20 21 22 23 24 63.0 62.1 61.1 60.1 59.1 48 49 50 51 52 53 54 55 36.0 35.1 34.2 33.3 32.3 25 26 27 58.2 57.2 56.2 31.4 30.5 29.6 Appendix C. (Continued) Age 56 57 58 59 60 Table 1 (Single Life Expectancy) (For Use by Beneficiaries) Life Expectancy Age 28.7 84 27.9 85 27.0 86 26.1 87 25.2 88 24.4 89 23.5 90 22.7 91 21.8 92 21.0 93 Life Expectancy 8.1 7.6 7.1 6.7 6.3 61 62 63 64 65 5.9 5.5 5.2 4.9 4.6 66 67 68 69 70 20.2 19.4 18.6 17.8 17.0 94 95 96 97 98 4.3 4.1 3.8 3.6 3.4 71 72 73 74 75 16.3 15.5 14.8 14.1 13.4 99 100 101 102 103 3.1 2.9 2.7 2.5 2.3 76 77 78 79 80 12.7 12.1 11.4 10.8 10.2 104 105 106 107 108 2.1 1.9 1.7 1.5 1.4 81 82 83 9.7 9.1 8.6 109 110 111 and over 1.2 1.1 1.0 Appendix C. Uniform Lifetime Table 72 Table III (Uniform Lifetime) (For Use by: Unmarried Owners, Married Owners Whose Spouses Are Not More Than 10 Years Younger, and Married Owners Whose Spouses Are Not the Sole Beneficiaries of Their IRAS) Age Distribution Period Age Distribution Period 70 27.4 93 9.6 71 26.5 94 9.1 25.6 95 8.6 73 24.7 96 8.1 74 23.8 97 7.6 75 22.9 98 7.1 76 22.0 99 6.7 77 21.2 100 6.3 78 20.3 101 5.9 79 19.5 102 5.5 80 18.7 103 5.2 81 17.9 104 4.9 82 17.1 105 4.5 83 16.3 106 4.2 84 15.5 3.9 85 14.8 108 3.7 86 14.1 3.4 87 13.4 110 3.1 88 12.7 2.9 89 12.0 112 2.6 90 11.4 113 2.4 91 10.8 114 2.1 92 10.2 115 and over 1.9 107 109 111 Appendix C. (Continued) 59 Ages 97 98 99 100 101 102 103 104 Table II (continued) (Joint Life and Last Survivor Expectancy) (For Use by Owners Whose Spouses Are More Than 10 Years Younger and Are the Sole Beneficiaries of Their IRAs) 50 51 52 53 54 55 56 57 58 34.2 33.3 32.4 31.5 30.6 29.7 28.8 27.9 27.0 34.2 33.3 32.4 31.5 30.6 29.7 28.8 27.9 27.0 34.2 33.3 32.4 31.5 30.6 29.7 28.8 27.9 27.0 34.2 33.3 32.4 31.5 30.6 29.7 28.8 27.9 27.0 34.2 33.3 32.4 31.5 30.6 29.7 28.8 27.9 27.0 34.2 33.3 32.4 31.4 30.5 29.7 28.8 27.9 27.0 34.2 33.3 32.4 31.4 30.5 29.7 28.8 27.9 27.0 34.2 33.3 32.4 31.4 30.5 29.6 28.8 27.9 27.0 34.2 33.3 32.3 31.4 30.5 29.6 28.8 27.9 27.0 34.2 33.3 32.3 31.4 30.5 29.6 28.8 27.9 27.0 34.2 33.3 32.3 31.4 30.5 29.6 28.8 27.9 27.0 34.2 33.3 32.3 31.4 30.5 29.6 28.8 27.9 27.0 34.2 33.3 32.3 31.4 30.5 29.6 28.7 27.9 27.0 34.2 33.3 32.3 31.4 30.5 29.6 28.7 27.9 27.0 34.2 33.3 32.3 31.4 30.5 29.6 28.7 27.9 27.0 34.2 33.3 32.3 31.4 30.5 29.6 28.7 27.9 27.0 34.2 33.3 32.3 31.4 30.5 29.6 28.7 27.9 27.0 34.2 33.3 32.3 31.4 30.5 27.9 27.0 34.2 33.3 32.3 31.4 30.5 29.6 28.7 27.9 27.0 26.2 26.2 26.2 26.1 26.1 26.1 26.1 26.1 105 106 107 108 109 26.1 26.1 26.1 26.1 26.1 110 111 112 113 114 26.1 26.1 26.1 26.1 26.1 29.6 28.7 115+ 26.1 Ages 69 60 61 62 63 64 27.6 27.0 26.4 25.7 25.2 65 66 Table II (continued) (Joint Life and Last Survivor Expectancy) (For Use by Owners Whose Spouses Are More Than 10 Years Younger and Are the Sole Beneficiaries of Their IRAs) 60 61 62 63 64 65 66 67 68 30.9 30.4 30.0 29.6 29.2 28.8 28.5 28.2 27.9 30.4 29.9 29.5 29.0 28.6 28.3 27.9 27.6 27.3 30.0 29.5 29.0 28.5 28.1 27.7 27.3 27.0 26.7 29.6 29.0 28.5 28.1 27.6 27.2 26.8 26.4 26.1 29.2 28.6 28.1 27.6 27.1 26.7 26.3 25.9 25.5 28.8 28.3 27.7 27.2 26.7 26.2 25.8 25.4 25.0 28.5 27.9 27.3 26.8 26.3 25.8 25.3 24.9 24.5 28.2 27.6 27.0 26.4 25.9 25.4 24.9 24.4 24.0 27.9 27.3 26.7 26.1 25.5 25.0 24.5 24.0 23.5 27.6 27.0 26.4 25.7 25.2 24.6 24.1 23.6 23.1 27.4 26.7 26.1 25.4 24.8 24.3 23.7 23.2 22.7 27.2 26.5 25.8 25.2 24.5 23.9 23.4 22.8 22.3 27.0 26.3 25.6 24.9 24.3 23.7 23.1 22.5 22.0 26.8 26.1 25.4 24.7 24.0 23.4 22.8 22.2 21.6 26.6 25.9 25.2 24.5 23.8 23.1 22.5 21.9 21.3 26.5 25.7 25.0 24.3 23.6 22.9 22.3 21.6 21.0 67 68 69 24.6 24.1 23.6 23.1 22.6 22.2 21.8 21.4 21.1 20.8 70 71 72 73 74 75 20.5 Appendix C. (Continued) Ages 69 76 77 78 79 20.2 19.9 19.7 19.5 20.6 80 81 82 83 84 24.1 23.4 21.8 19.3 19.1 19.0 18.8 18.7 85 86 87 88 89 18.6 18.5 18.4 18.3 18.3 90 25.4 23.7 22.9 91 92 93 94 Table II (continued) (Joint Life and Last Survivor Expectancy) (For Use by Owners Whose Spouses Are More Than 10 Years Younger and Are the Sole Beneficiaries of Their IRAs) 60 61 62 63 64 65 66 67 68 26.3 25.6 24.8 24.1 23.4 22.7 22.0 21.4 20.8 26.2 25.4 24.7 23.9 23.2 22.5 21.8 21.2 20.6 26.1 25.3 24.6 23.8 23.1 22.4 21.7 21.0 20.3 26.0 25.2 24.4 23.7 22.9 22.2 21.5 20.8 20.1 25.9 25.1 24.3 23.6 22.8 22.1 21.3 20.0 25.8 25.0 24.2 23.4 22.7 21.9 21.2 20.5 19.8 25.8 24.9 22.6 21.1 20.4 19.7 25.7 24.9 24.1 23.3 22.5 21.7 21.0 20.2 19.5 25.6 24.8 24.0 23.2 22.4 21.6 20.9 20.1 19.4 25.6 24.8 23.9 23.1 22.3 21.6 20.8 20.1 19.3 25.5 24.7 23.9 23.1 22.3 21.5 20.7 20.0 19.2 25.5 24.7 23.8 23.0 22.2 21.4 20.7 19.9 19.2 25.5 24.6 23.8 23.0 22.2 21.4 20.6 19.8 19.1 25.4 24.6 23.8 22.9 22.1 21.3 20.5 19.8 19.0 25.4 24.6 23.7 22.9 22.1 21.3 20.5 19.7 19.0 25.4 24.5 23.7 22.9 22.1 21.3 20.5 19.7 18.9 24.5 22.0 21.2 20.4 19.6 18.9 25.4 24.5 23.7 22.8 22.0 21.2 20.4 19.6 18.8 25.3 23.6 22.8 22.0 21.2 20.4 19.6 25.3 24.5 23.6 22.8 22.0 21.1 20.3 19.6 18.8 25.3 24.5 23.6 22.8 21.9 21.1 20.3 19.5 18.8 25.3 24.5 23.6 22.8 21.9 21.1 20.3 19.5 18.7 25.3 24.4 23.6 22.8 21.9 21.1 20.3 19.5 18.7 25.3 24.4 23.6 22.7 21.9 21.1 20.3 19.5 18.7 25.3 24.4 23.6 22.7 21.9 21.1 20.3 19.5 18.7 25.3 24.4 23.6 22.7 21.1 20.2 19.4 18.7 25.3 24.4 23.6 22.7 21.9 21.1 20.2 19.4 18.6 25.3 24.4 23.6 22.7 21.0 20.2 19.4 18.6 25.3 24.4 23.5 22.7 21.9 21.0 20.2 19.4 18.6 25.3 24.4 23.5 22.7 21.9 21.0 20.2 19.4 18.6 25.3 24.4 23.5 22.7 21.9 21.0 20.2 19.4 18.6 25.2 24.4 23.5 22.7 21.8 21.0 20.2 19.4 18.6 25.2 24.4 23.5 22.7 21.8 21.0 20.2 19.4 18.6 25.2 24.4 23.5 22.7 21.8 21.0 20.2 19.4 18.6 25.2 24.4 23.5 22.7 21.8 21.0 20.2 19.4 18.6 25.2 24.4 23.5 22.7 21.8 21.0 20.2 19.4 18.6 25.2 24.4 23.5 22.7 21.8 21.0 20.2 19.4 18.6 25.2 24.4 23.5 22.7 21.8 21.0 20.2 19.4 18.6 25.2 24.4 23.5 22.7 21.8 21.0 20.2 19.4 18.6 25.2 24.4 23.5 22.7 21.8 21.0 20.2 19.4 18.6 24.5 18.8 18.2 18.2 18.1 18.1 18.0 18.0 18.0 18.0 17.9 17.9 95 96 97 98 99 21.9 100 101 102 103 104 17.9 17.9 17.9 17.9 17.8 21.9 105 106 107 108 109 17.8 17.8 17.8 17.8 17.8 110 111 112 113 114 17.8 17.8 17.8 17.8 17.8 115+ 17.8 Appendix C. (Continued) 79 Ages 70 71 72 73 74 18.9 18.3 17.7 17.2 16.7 17.2 16.5 16.2 15.7 75 76 77 78 79 16.4 15.3 14.9 14.5 80 81 82 83 14.1 13.8 13.5 13.2 13.0 84 14.4 85 86 87 88 89 Table II (continued) (Joint Life and Last Survivor Expectancy) (For Use by Owners Whose Spouses Are More Than 10 Years Younger and Are the Sole Beneficiaries of Their IRAs) 70 71 72 73 74 75 76 77 78 21.8 21.3 20.9 20.6 20.2 19.9 19.6 19.4 19.1 21.3 20.9 20.5 20.1 19.7 19.4 19.1 18.8 18.5 20.9 20.5 20.0 19.6 19.3 18.9 18.6 18.3 18.0 20.6 20.1 19.6 19.2 18.8 18.4 18.1 17.8 17.5 20.2 19.7 19.3 18.8 18.4 18.0 17.6 17.3 17.0 19.9 19.4 18.9 18.4 18.0 17.6 16.8 19.6 19.1 18.6 18.1 17.6 17.2 16.8 16.4 16.0 19.4 18.8 18.3 17.8 17.3 16.8 16.0 15.6 19.1 18.5 18.0 17.5 17.0 16.5 16.0 15.6 15.2 18.9 18.3 17.7 17.2 16.7 16.2 15.7 15.3 14.9 18.7 18.1 17.5 16.9 16.4 15.9 15.4 15.0 14.5 18.5 17.9 17.3 16.7 16.2 15.6 15.1 14.7 14.2 18.3 17.7 17.1 16.5 15.9 15.4 14.9 14.4 13.9 18.2 17.5 16.9 16.3 15.7 15.2 14.7 14.2 13.7 18.0 17.4 16.7 16.1 15.5 15.0 13.9 13.4 17.9 17.3 16.6 16.0 15.4 14.8 14.3 13.7 13.2 17.8 17.1 16.5 15.8 15.2 14.6 14.1 13.5 13.0 17.7 17.0 16.4 15.7 15.1 14.5 13.9 13.4 12.9 17.6 16.9 16.3 15.6 15.0 14.4 13.8 13.2 12.7 17.6 16.9 16.2 15.5 14.9 14.3 13.7 13.1 12.6 17.5 16.8 15.4 14.8 14.2 13.6 13.0 12.4 17.4 16.7 16.0 15.4 14.7 14.1 13.5 12.9 12.3 16.7 16.0 15.3 14.6 14.0 12.8 12.2 17.3 16.6 15.9 15.2 14.6 13.9 13.3 12.7 12.1 17.3 16.6 15.9 15.2 14.5 13.9 13.2 12.0 17.3 16.5 15.8 15.1 14.5 13.8 13.2 12.6 12.0 17.2 16.5 15.8 15.1 14.4 13.8 13.1 12.5 11.9 17.2 16.5 15.8 15.1 14.4 13.7 13.1 12.5 11.9 17.2 16.4 15.7 15.0 14.3 13.7 13.0 12.4 11.8 17.2 16.4 15.7 15.0 14.3 13.6 13.0 12.4 11.8 17.1 16.4 15.7 15.0 14.3 13.6 12.9 12.3 11.7 17.1 16.4 15.6 14.9 14.2 13.6 12.9 12.3 17.1 16.4 15.6 14.9 14.2 13.5 12.9 12.2 11.6 17.1 16.3 14.2 13.5 12.2 11.6 17.1 16.3 15.6 14.9 14.2 13.5 12.8 12.2 11.6 17.1 16.3 15.6 14.9 14.2 13.5 12.2 11.5 17.1 16.3 15.6 14.8 14.1 13.5 12.8 12.2 11.5 17.0 16.3 15.6 14.8 14.1 13.4 12.8 12.1 17.0 16.3 15.5 14.8 14.1 13.4 12.8 12.1 11.5 15.5 14.8 14.1 13.4 12.8 12.1 11.5 12.8 12.5 12.4 12.2 12.0 16.1 11.9 90 91 92 93 94 17.4 13.4 12.6 95 96 97 98 99 11.8 11.7 11.6 11.5 11.4 11.3 11.3 11.2 11.2 11.7 11.1 11.1 11.0 11.0 11.0 15.6 14.9 12.9 100 101 102 103 104 105 106 107 108 109 12.8 11.5 10.9 10.9 10.9 10.9 10.9 17.0 16.3 Appendix C. (Continued) Ages 110 111 112 113 114 Table II (continued) (Joint Life and Last Survivor Expectancy) (For Use by Owners Whose Spouses Are More Than 10 Years Younger and Are the Sole Beneficiaries of Their IRAs) 70 71 72 73 74 75 76 77 78 17.0 16.3 15.5 14.8 14.1 13.4 12.7 12.1 11.5 17.0 16.3 15.5 14.8 14.1 13.4 12.7 12.1 11.5 17.0 16.3 15.5 14.8 14.1 13.4 12.7 12.1 11.5 17.0 16.3 15.5 14.8 14.1 13.4 12.7 12.1 11.4 17.0 16.3 15.5 14.8 14.1 13.4 12.7 12.1 11.4 17.0 16.3 15.5 14.8 14.1 13.4 12.7 12.1 11.4 79 10.9 10.8 10.8 10.8 10.8 10.8 115+ 89 Ages 80 81 82 83 84 85 86 87 88 89 11.5 11.1 10.6 10.2 9.9 9.5 9.2 8.9 8.6 8.3 8.1 7.9 7.7 7.5 7.3 7.2 7.1 6.9 6.8 6.7 90 91 92 93 94 Table II (continued) (Joint Life and Last Survivor Expectancy) (For Use by Owners Whose Spouses Are More Than 10 Years Younger and Are the Sole Beneficiaries of Their IRAs) 80 81 82 83 84 85 86 87 88 13.8 13.4 13.1 12.8 12.6 12.3 12.1 11.9 11.7 13.4 13.1 12.7 12.4 12.2 11.9 11.7 11.4 11.3 13.1 12.7 12.4 12.1 11.8 11.5 11.3 11.0 10.8 12.8 12.4 12.1 11.7 11.4 11.1 10.9 10.6 10.4 12.6 12.2 11.8 11.4 11.1 10.8 10.5 10.3 10.1 12.3 11.9 11.5 11.1 10.8 10.5 10.2 9.9 9.7 12.1 11.7 11.3 10.9 10.5 10.2 9.9 9.6 9.4 11.9 11.4 11.0 10.6 10.3 9.9 9.6 9.4 9.1 11.7 11.3 10.8 10.4 10.1 9.7 9.4 9.1 8.8 11.5 11.1 10.6 10.2 9.9 9.5 9.2 8.9 8.6 11.4 10.9 10.5 10.1 9.7 9.3 9.0 8.6 8.3 11.3 10.8 10.3 9.9 9.5 9.1 8.8 8.4 8.1 11.2 10.7 10.2 9.8 9.3 9.0 8.6 8.3 8,0 11.1 10.6 10.1 9.6 9.2 8.8 8.5 8.1 7.8 11.0 10.5 10.0 9.5 9.1 8.7 8.3 8.0 7.6 10.9 10.4 9.9 9.4 9.0 8.6 8.2 7.8 7.5 10.8 10.3 9.8 9.3 8.9 8.5 8.1 7.7 7.4 10.7 10.2 9.7 9.2 8.8 8.4 8.0 7.6 7.3 10.7 10.1 9.6 9.2 8.7 8.3 7.9 7.5 7.1 10.6 10.1 9.1 8.6 8.2 7.8 7.4 7.0 10.6 10.0 9.5 9.0 8.5 8.1 7.7 7.3 6.9 10.5 10.0 9.4 9.0 8.5 8.0 7.6 7.2 6.9 10.5 9.9 9.4 8.9 8.4 8.0 7.5 7.1 6.8 10.4 9.9 9.4 8.8 8.4 7.9 7.5 7.1 6.7 10.4 9.8 9.3 8.8 8.3 7.9 7.4 7.0 6.6 10.4 9.8 9.3 8.8 8.3 7.8 7.4 7.0 6.6 10.3 9.8 9.2 8.7 8.2 7.8 7.3 6.9 6.5 10.3 9.8 9.2 8.7 8.2 7.7 7.3 6.9 6.5 10.3 9.7 9.2 8.7 8.2 7.7 7.3 6.8 6.4 10.3 9.7 9.2 8.7 8.2 7.7 7.2 6.8 6.4 10.3 9.7 9.2 8.6 8.1 7.7 7.2 6.8 6.4 10.3 9.7 9.1 8.6 8.1 7.6 7.2 6.8 6.3 10.2 9.7 9.1 8.6 8.1 7.6 7.2 6.7 6.3 10.2 9.7 9.1 8.6 8.1 7.6 7.2 6.7 6.3 10.2 9.7 9.1 8.6 8.1 7.6 7.1 6.7 6.3 10.2 9.7 9.1 8.6 8.1 7.6 7.1 6.7 6.3 95 96 97 98 99 9.6 100 101 102 103 104 6.6 6.5 6.4 6.3 6.3 6.2 6.2 6.1 6.1 6.0 105 106 107 108 109 110 111 112 113 114 6.0 6.0 5.9 5.9 5.9 115+ 5.9 Page 106 Publication 590 (2012) Appendix C. (Continued) 99 Ages 90 91 92 93 94 7.6 6.4 6.1 5.9 5.6 5.4 95 96 97 98 99 100 101 102 103 104 Tablell (continued) (Joint Life and Last Survivor Expectancy) (For Use by Owners Whose Spouses Are More Than 10 Years Younger and Are the Sole Beneficiaries of Their IRAs) 90 91 92 93 94 95 96 97 98. 7.8 7.6 7.4 7.2 7.1 6.9 6.8 6.6 6.5 7.4 7.2 7.0 6.8 6.7 6.5 7.4 7.2 7.0 6.8 6.6 6.4 6.3 6.1 6.0 7.2 7.0 6.8 6.6 6.4 6.2 6.1 5.9 5.8 7.1 6.8 6.6 6.4 6.2 6.0 5.9 5.7 5.6 6.9 6.7 6.4 6.2 6.0 5.8 5.7 5.4 6.8 6.5 6.3 6.1 5.9 5.7 5.5 5.3 5.2 6.6 6.4 6.1 5.9 5.7 5.5 5.3 5.2 5.0 6.5 6.3 6.0 5.8 5.6 5.4 5.2 5.0 4.8 6.4 6.1 5.9 5.6 5.4 5.2 5.0 4.9 4.7 6.3 6.0 5.8 5.3 5.1 4.9 4.7 6.2 5.9 5.6 5.4 5.2 5.0 4.8 4.6 4.4 6.1 5.8 5.5 5.3 5.1 4.8 4.6 4.4 4.3 6.0 5.7 5.4 5.0 4.7 4.3 4.1 5.9 5.6 5.4 5.1 4.9 4.6 4.4 4.2 4.0 5.9 5.6 5.3 5.0 4.8 4.5 4.3 4.1 3.9 5.8 5.5 5.2 4.9 4.7 4.5 4.2 4.0 3.8 5.8 5.4 5.1 4.9 4.6 4.4 3.9 3.7 5.7 5.4 5.1 4.8 4.6 4.3 4.1 3.9 3.7 5.7 5.3 5.0 4.8 4.5 4.3 4.0 3.8 3.6 5.3 5.0 4.7 4.5 4.2 3.8 3.5 5.6 5.3 5.0 4.7 4.4 4.2 3.9 3.7 3.5 5.6 5.3 4.9 4.7 4.4 4.1 3.9 3.7 3.5 5.6 5.2 4.9 4.6 4.4 4.1 3.9 3.6 3.4 5.6 5.2 4.9 4.6 4.3 4.1 3.9 3.6 3.4 5.5 4.9 4.6 4.3 4.1 3.8 3.6 UNOON | - 0 - - - | 0 0 0 0 1 1 0 0 0 10 9 - 9 - 105 106 4.2 107 108 109 3.7 3.6 3.5 3.5 3.4 110 111 112 3.3 3.3 3.2 3.2 3.2 113 114 115+ 3.4 3.1 Appendix C. (Continued) 109 Ages 100 101 102 103 104 Table II (continued) (Joint Life and Last Survivor Expectancy) (For Use by Owners Whose Spouses Are More Than 10 Years Younger and Are the Sole Beneficiaries of Their IRAS) 100 101 102 103 104 105 106 107 108 4.2 4.1 3.9 3.8 3.7 3.5 3.4 3.3 3.3 4.1 3.9 3.7 3.6 3.5 3.4 3.2 3.1 3.1 3.9 3.7 3.6 3.4 3.3 3.2 3.1 3.0 2.9 3.8 3.6 3.4 3.3 3.2 3.0 2.9 2.7 3.7 3.5 3.3 3.2 3.0 2.9 2.7 2.6 2.5 3.2 3.0 2.8 2.6 2.4 105 106 107 108 109 3.5 3.4 3.3 3.3 3.2 3.4 3.2 3.1 3.1 3.0 3.2 3.1 3.0 2.9 2.8 00 ONA O 3.0 2.9 2.8 2.7 2.6 2.9 2.7 2.6 2.5 2.4 2.7 2.6 2.5 2.4 2.3 2.6 2.4 2.3 2.2 2.1 2.5 2.3 2.2 2.1 2.0 2.4 2.2 2.1 1.9 1.8 2.3 2.1 2.0 1.8 1.7 3.1 3.1 2.5 2.5 110 111 112 113 114 3.0 2.9 2.9 2.8 2.8 2.7 2.7 2.7 2.6 2.6 2.5 2.4 2.3 2.3 2.2 2.2 2.1 2.2 2.1 2.0 2.0 1.9 2.0 1.9 1.9 1.8 1.8 1.9 1.8 1.7 1.6 1.6 1.7 1.6 1.5 1.5 1.4 1.6 1.5 1.4 1.3 1.3 3.0 3.0 2.4 2.3 115+ 2.9 2.7 2.3 2.1 1.9 1.7 1.5 1.4 1.2 Ages 110 Table II (continued) (Joint Life and Last Survivor Expectancy) (For Use by Owners Whose Spouses Are More Than 10 Years Younger and Are the Sole Beneficiaries of Their IRAS) 110 111 112 113 114 115+ 1.5 1.4 1.3 1.2 1.1 1.1 1.4 1.2 1.1 1.1 1.0 1.0 1.3 1.1 1.0 1.0 1.0 1.0 1.2 1.1 1.0 1.0 1.0 1.0 1.1 1.0 1.0 1.0 1.0 1.0 1.1 1.0 1.0 1.0 1.0 1.0 111 112 113 114 115+ Appendix C. Life Expectancy Tables Age Table 1 (Single Life Expectancy) (For Use by Beneficiaries) Life Expectancy Age 82.4 28 81.6 29 80.6 30 79.7 31 78.7 32 1 2 3 Life Expectancy 55.3 54.3 53.3 52.4 51.4 4 5 6 7 8 77.7 76.7 75.8 74.8 73.8 33 34 35 36 37 50.4 49.4 48.5 47.5 46.5 9 10 11 12 13 14 38 39 40 41 42 45.6 44.6 43.6 42.7 41.7 72.8 71.8 70.8 69.9 68.9 67.9 66.9 66.0 65.0 64.0 15 16 17 18 19 43 44 45 46 47 40.7 39.8 38.8 37.9 37.0 20 21 22 23 24 63.0 62.1 61.1 60.1 59.1 48 49 50 51 52 53 54 55 36.0 35.1 34.2 33.3 32.3 25 26 27 58.2 57.2 56.2 31.4 30.5 29.6 Appendix C. (Continued) Age 56 57 58 59 60 Table 1 (Single Life Expectancy) (For Use by Beneficiaries) Life Expectancy Age 28.7 84 27.9 85 27.0 86 26.1 87 25.2 88 24.4 89 23.5 90 22.7 91 21.8 92 21.0 93 Life Expectancy 8.1 7.6 7.1 6.7 6.3 61 62 63 64 65 5.9 5.5 5.2 4.9 4.6 66 67 68 69 70 20.2 19.4 18.6 17.8 17.0 94 95 96 97 98 4.3 4.1 3.8 3.6 3.4 71 72 73 74 75 16.3 15.5 14.8 14.1 13.4 99 100 101 102 103 3.1 2.9 2.7 2.5 2.3 76 77 78 79 80 12.7 12.1 11.4 10.8 10.2 104 105 106 107 108 2.1 1.9 1.7 1.5 1.4 81 82 83 9.7 9.1 8.6 109 110 111 and over 1.2 1.1 1.0
Step by Step Solution
There are 3 Steps involved in it

Get step-by-step solutions from verified subject matter experts