

Question: How to code this in MATLAB 7. Use the get, set, and gca to change the properties in the previous figures such as the line
How to code this in MATLAB
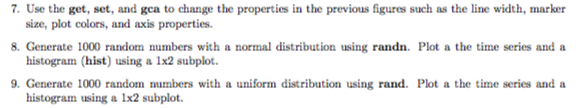
7. Use the get, set, and gca to change the properties in the previous figures such as the line width, marker 8. Generate 1000 random numbers with a normal distribution using randn. Plot a the time series and a 9. Generate 1000 random numbers with a uniform distribution using rand. Plot a the time series and a size, plot colors, and axis properties. histogram (hist) using a 1x2 subplot. histogram using a 1x2 subplot
Step by Step Solution
There are 3 Steps involved in it
1 Expert Approved Answer
Step: 1 Unlock

Question Has Been Solved by an Expert!
Get step-by-step solutions from verified subject matter experts
Step: 2 Unlock
Step: 3 Unlock