

Question: how to do a b and c? model answers please? Part 2. Passengers landing at Heathrow airport need to go through passport control checks in
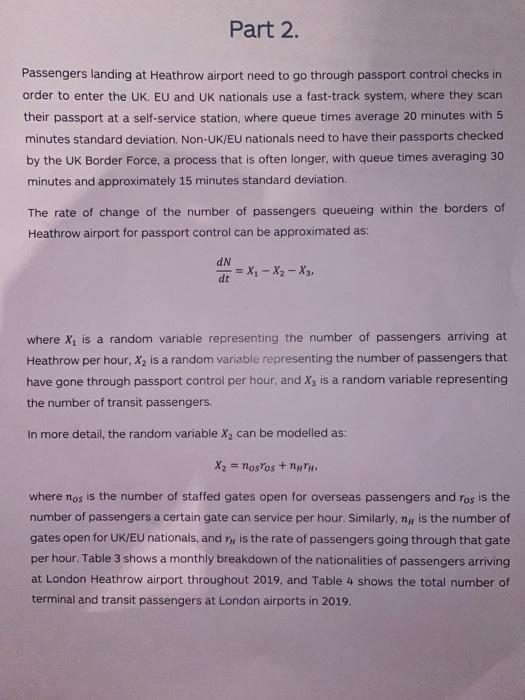
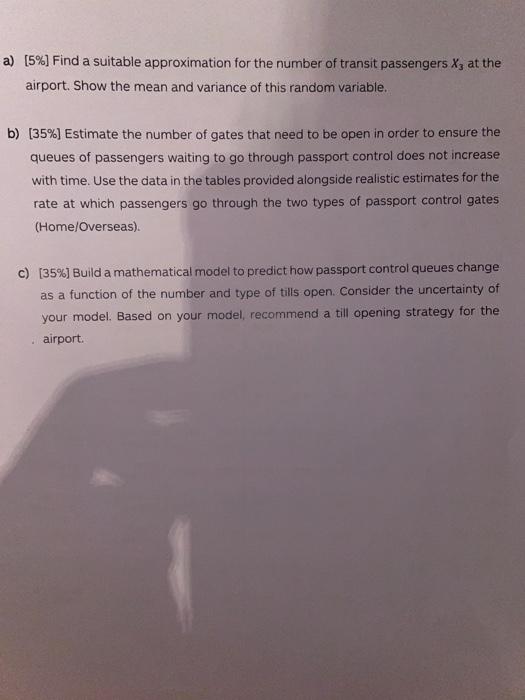
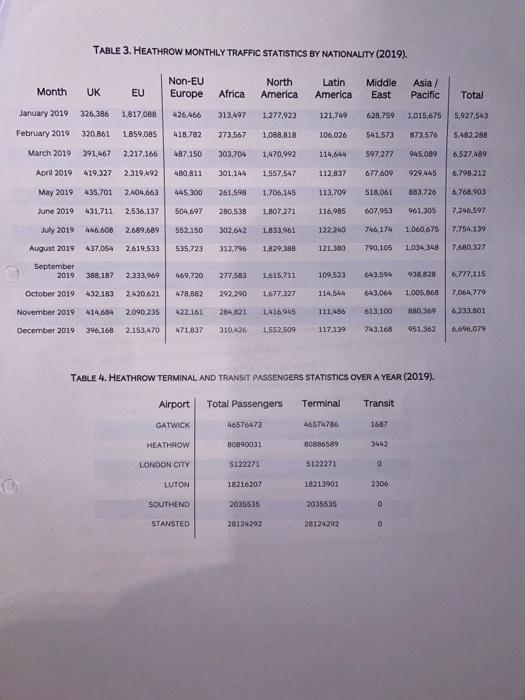
Part 2. Passengers landing at Heathrow airport need to go through passport control checks in order to enter the UK. EU and UK nationals use a fast-track system, where they scan their passport at a self-service station, where queue times average 20 minutes with 5 minutes standard deviation. Non-UK/EU nationals need to have their passports checked by the UK Border Force, a process that is often longer, with queue times averaging 30 minutes and approximately 15 minutes standard deviation The rate of change of the number of passengers queueing within the borders of Heathrow airport for passport control can be approximated as: dN -= X, -- X2 - X3. dt where X, is a random variable representing the number of passengers arriving at Heathrow per hour, X2 is a random variable representing the number of passengers that have gone through passport control per hour, and X, is a random variable representing the number of transit passengers. In more detail, the random variable X, can be modelled as: X2 = Mostos + where nos is the number of staffed gates open for overseas passengers and ros is the number of passengers a certain gate can service per hour. Similarly, ny is the number of gates open for UK/EU nationals, and is the rate of passengers going through that gate per hour. Table 3 shows a monthly breakdown of the nationalities of passengers arriving at London Heathrow airport throughout 2019, and Table 4 shows the total number of terminal and transit passengers at London airports in 2019. a) (5%) Find a suitable approximation for the number of transit passengers X3 at the airport. Show the mean and variance of this random variable. b) (35%) Estimate the number of gates that need to be open in order to ensure the queues of passengers waiting to go through passport control does not increase with time. Use the data in the tables provided alongside realistic estimates for the rate at which passengers go through the two types of passport control gates (Home/Overseas). c) (35%) Build a mathematical model to predict how passport control queues change as a function of the number and type of tills open. Consider the uncertainty of your model. Based on your model, recommend a till opening strategy for the airport TABLE 3. HEATHROW MONTHLY TRAFFIC STATISTICS BY NATIONALITY (2019). Month UK EU Non-EU Europe North America Latin America Middle East Africa Asia/ Pacific Total January 2019 326,386 1.817,088 426,466 313.497 1,277,923 121,749 629,759 1,015,675 5,927,543 February 2010 320,861 1.859,085 418,782 273,567 1,088,818 106 026 541.573 873,576 5,482 288 March 2010 391,467 2.217.166 487.150 303,704 1,470,992 114,645 597,277 945,089 6.527 489 April 2019 419.327 2.319.492 480.811 301.144 1,557,547 112,837 677.609 929.445 6.798,212 May 2019 435,701 2404,663 445,300 261,598 1,706,145 113,709 515,061 883.726 6,768.903 June 2019 431711 2,536,137 504,097 280,538 1,807,271 116,985 607,953 961,305 7.246,597 July 2010 446,608 2,689,689 552,150 302,642 1,833,961 122.240 746, 174 1.060,675 7.754,139 August 2019 437,054 2.619,533 535,723 312.796 1,829,388 121380 790,105 1,034 348 7.680,327 September 2019 388.187 2.333.969 469,720 1,615,211 109,523 643,594 938,828 6.777.115 277.583 292 290 October 2010 432.183 2.420,621 478,882 1,677,327 114.544 643,064 7,064,779 1,005,868 880 369 November 2019 414.684 2.090.235 422.161 204.821 1,416.95 111.456 613.100 8.233,801 December 2010 396,168 2.153.470 471,837 310426 1.552,509 117,139 743,168 951, 362 6,696,079 TABLE 4. HEATHROW TERMINAL AND TRANSIT PASSENGERS STATISTICS OVER A YEAR (2019). Alrport Total Passengers Terminal Transit GATWICK 46576473 46574786 1687 HEATHROW 80890031 80636589 LONDON CITY 5122271 5122271 0 LUTON 18213901 2306 18216207 2035535 SOUTHEND 2035535 0 STANSTED 28124292 28124292 0 Part 2. Passengers landing at Heathrow airport need to go through passport control checks in order to enter the UK. EU and UK nationals use a fast-track system, where they scan their passport at a self-service station, where queue times average 20 minutes with 5 minutes standard deviation. Non-UK/EU nationals need to have their passports checked by the UK Border Force, a process that is often longer, with queue times averaging 30 minutes and approximately 15 minutes standard deviation The rate of change of the number of passengers queueing within the borders of Heathrow airport for passport control can be approximated as: dN -= X, -- X2 - X3. dt where X, is a random variable representing the number of passengers arriving at Heathrow per hour, X2 is a random variable representing the number of passengers that have gone through passport control per hour, and X, is a random variable representing the number of transit passengers. In more detail, the random variable X, can be modelled as: X2 = Mostos + where nos is the number of staffed gates open for overseas passengers and ros is the number of passengers a certain gate can service per hour. Similarly, ny is the number of gates open for UK/EU nationals, and is the rate of passengers going through that gate per hour. Table 3 shows a monthly breakdown of the nationalities of passengers arriving at London Heathrow airport throughout 2019, and Table 4 shows the total number of terminal and transit passengers at London airports in 2019. a) (5%) Find a suitable approximation for the number of transit passengers X3 at the airport. Show the mean and variance of this random variable. b) (35%) Estimate the number of gates that need to be open in order to ensure the queues of passengers waiting to go through passport control does not increase with time. Use the data in the tables provided alongside realistic estimates for the rate at which passengers go through the two types of passport control gates (Home/Overseas). c) (35%) Build a mathematical model to predict how passport control queues change as a function of the number and type of tills open. Consider the uncertainty of your model. Based on your model, recommend a till opening strategy for the airport TABLE 3. HEATHROW MONTHLY TRAFFIC STATISTICS BY NATIONALITY (2019). Month UK EU Non-EU Europe North America Latin America Middle East Africa Asia/ Pacific Total January 2019 326,386 1.817,088 426,466 313.497 1,277,923 121,749 629,759 1,015,675 5,927,543 February 2010 320,861 1.859,085 418,782 273,567 1,088,818 106 026 541.573 873,576 5,482 288 March 2010 391,467 2.217.166 487.150 303,704 1,470,992 114,645 597,277 945,089 6.527 489 April 2019 419.327 2.319.492 480.811 301.144 1,557,547 112,837 677.609 929.445 6.798,212 May 2019 435,701 2404,663 445,300 261,598 1,706,145 113,709 515,061 883.726 6,768.903 June 2019 431711 2,536,137 504,097 280,538 1,807,271 116,985 607,953 961,305 7.246,597 July 2010 446,608 2,689,689 552,150 302,642 1,833,961 122.240 746, 174 1.060,675 7.754,139 August 2019 437,054 2.619,533 535,723 312.796 1,829,388 121380 790,105 1,034 348 7.680,327 September 2019 388.187 2.333.969 469,720 1,615,211 109,523 643,594 938,828 6.777.115 277.583 292 290 October 2010 432.183 2.420,621 478,882 1,677,327 114.544 643,064 7,064,779 1,005,868 880 369 November 2019 414.684 2.090.235 422.161 204.821 1,416.95 111.456 613.100 8.233,801 December 2010 396,168 2.153.470 471,837 310426 1.552,509 117,139 743,168 951, 362 6,696,079 TABLE 4. HEATHROW TERMINAL AND TRANSIT PASSENGERS STATISTICS OVER A YEAR (2019). Alrport Total Passengers Terminal Transit GATWICK 46576473 46574786 1687 HEATHROW 80890031 80636589 LONDON CITY 5122271 5122271 0 LUTON 18213901 2306 18216207 2035535 SOUTHEND 2035535 0 STANSTED 28124292 28124292 0
Step by Step Solution
There are 3 Steps involved in it

Get step-by-step solutions from verified subject matter experts