

Question: How to do the excel, please help! The CAPM is one of the most tested models in Finance. When beta is estimated in practice, a
![Ri] Since CAPM is an equation, we can subtract the risk-free rate](https://s3.amazonaws.com/si.experts.images/answers/2024/07/66aa0efeeb148_99066aa0efe71cf9.jpg) How to do the excel, please help!
How to do the excel, please help!
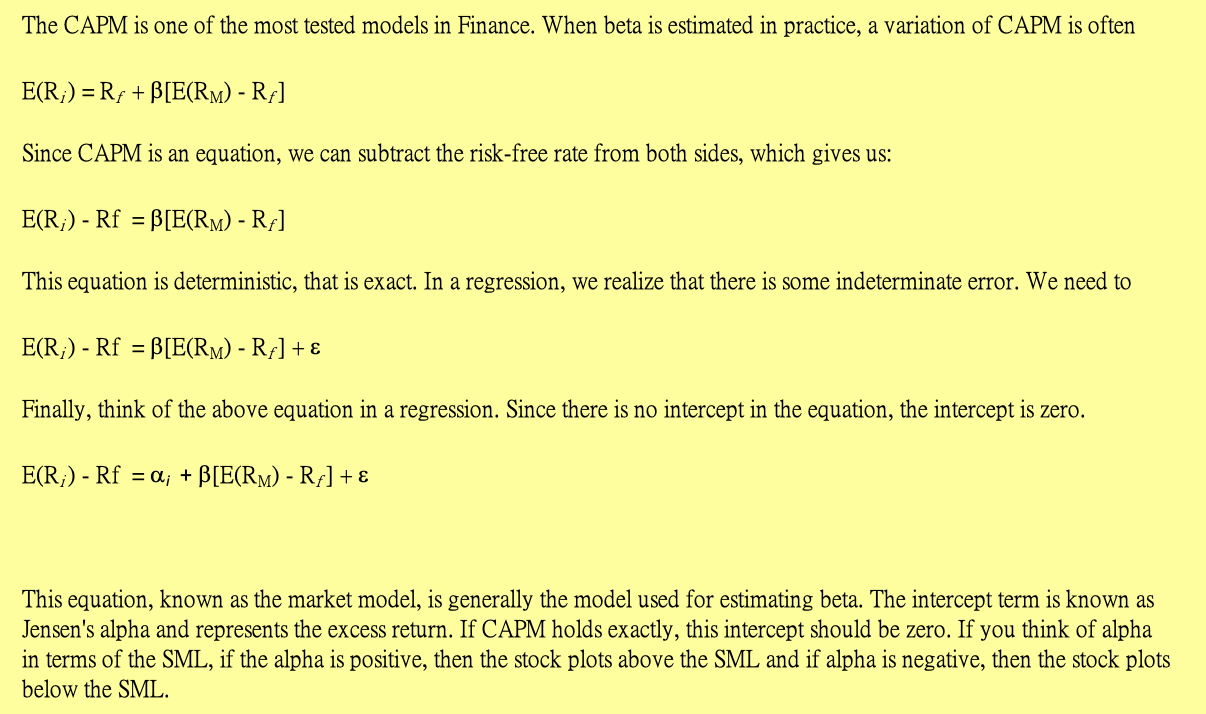
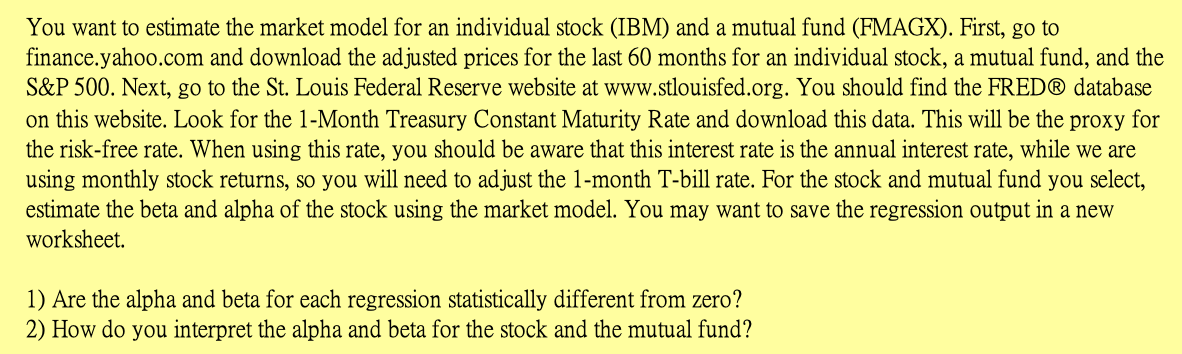
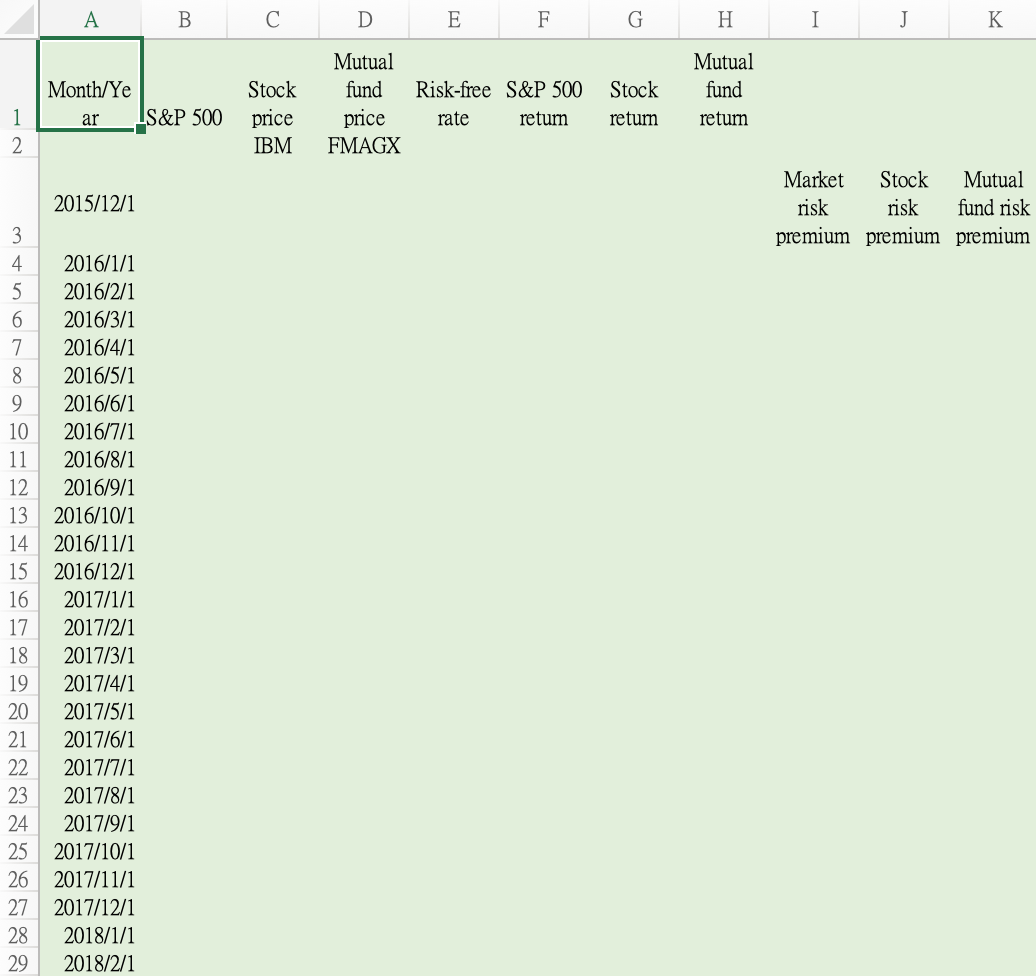
The CAPM is one of the most tested models in Finance. When beta is estimated in practice, a variation of CAPM is often E(R;) =Rf + B[E(RM) - Ri] Since CAPM is an equation, we can subtract the risk-free rate from both sides, which gives us: E(R;) - Rf = [E(RM) - Ri] This equation is deterministic, that is exact. In a regression, we realize that there is some indeterminate error. We need to E(R;) - Rf = B[E(RM) - Rp] + E Finally, think of the above equation in a regression. Since there is no intercept in the equation, the intercept is zero. E(R;) - Rf = 0; + B[E(RM) - R1] + This equation, known as the market model, is generally the model used for estimating beta. The intercept term is known as Jensen's alpha and represents the excess return. If CAPM holds exactly, this intercept should be zero. If you think of alpha in terms of the SML, if the alpha is positive, then the stock plots above the SML and if alpha is negative, then the stock plots below the SML. You want to estimate the market model for an individual stock (IBM) and a mutual fund (FMAGX). First, go to finance.yahoo.com and download the adjusted prices for the last 60 months for an individual stock, a mutual fund, and the S&P 500. Next, go to the St. Louis Federal Reserve website at www.stlouisfed.org. You should find the FRED database on this website. Look for the 1-Month Treasury Constant Maturity Rate and download this data. This will be the proxy for the risk-free rate. When using this rate, you should be aware that this interest rate is the annual interest rate, while we are using monthly stock returns, so you will need to adjust the 1-month T-bill rate. For the stock and mutual fund you select, estimate the beta and alpha of the stock using the market model. You may want to save the regression output in a new worksheet. 1) Are the alpha and beta for each regression statistically different from zero? 2) How do you interpret the alpha and beta for the stock and the mutual fund? A B D E F G H I J K Mutual fund Month/Ye ar LS&P 500 Mutual fund price FMAGX Stock price IBM Risk-free S&P 500 rate retum Stock return 1 2 return Market Stock Mutual risk risk fund risk premium premium premium 2015/12/1 3 4 2016/1/1 5 2016/2/1 6 2016/3/1 7 2016/4/1 8 2016/5/1 9 2016/6/1 10 2016/7/1 11 2016/8/1 12 2016/9/1 13 2016/10/1 14 2016/11/1 15 2016/12/1 16 2017/1/1 17 2017/2/1 18 2017/3/1 19 2017/4/1 20 2017/5/1 21 2017/6/1 22 2017/7/1 23 2017/8/1 24 2017/9/1 25 2017/10/1 26 2017/11/1 27 2017/12/1 28 2018/1/1 29 2018/2/1 B D E F G H I J K A 29 2018/2/1 30 2018/3/1 31 2018/4/1 32 2018/5/1 33 2018/6/1 34 2018/7/1 35 2018/8/1 36 2018/9/1 37 2018/10/1 38 2018/11/1 39 2018/12/1 40 2019/1/1 41 2019/2/1 42 2019/3/1 43 2019/4/1 44 2019/5/1 45 2019/6/1 46 2019/7/1 47 2019/8/1 48 2019/9/1 49 2019/10/1 50 2019/11/1 51 2019/12/1 52 2020/1/1 53 2020/2/1 54 2020/3/1 55 2020/4/1 56 2020/5/1 57 2020/6/1 58 2020/7/1 59 2020/8/1 60 2020/9/1 61 2020/10/1 62 2020/11/1 The CAPM is one of the most tested models in Finance. When beta is estimated in practice, a variation of CAPM is often E(R;) =Rf + B[E(RM) - Ri] Since CAPM is an equation, we can subtract the risk-free rate from both sides, which gives us: E(R;) - Rf = [E(RM) - Ri] This equation is deterministic, that is exact. In a regression, we realize that there is some indeterminate error. We need to E(R;) - Rf = B[E(RM) - Rp] + E Finally, think of the above equation in a regression. Since there is no intercept in the equation, the intercept is zero. E(R;) - Rf = 0; + B[E(RM) - R1] + This equation, known as the market model, is generally the model used for estimating beta. The intercept term is known as Jensen's alpha and represents the excess return. If CAPM holds exactly, this intercept should be zero. If you think of alpha in terms of the SML, if the alpha is positive, then the stock plots above the SML and if alpha is negative, then the stock plots below the SML. You want to estimate the market model for an individual stock (IBM) and a mutual fund (FMAGX). First, go to finance.yahoo.com and download the adjusted prices for the last 60 months for an individual stock, a mutual fund, and the S&P 500. Next, go to the St. Louis Federal Reserve website at www.stlouisfed.org. You should find the FRED database on this website. Look for the 1-Month Treasury Constant Maturity Rate and download this data. This will be the proxy for the risk-free rate. When using this rate, you should be aware that this interest rate is the annual interest rate, while we are using monthly stock returns, so you will need to adjust the 1-month T-bill rate. For the stock and mutual fund you select, estimate the beta and alpha of the stock using the market model. You may want to save the regression output in a new worksheet. 1) Are the alpha and beta for each regression statistically different from zero? 2) How do you interpret the alpha and beta for the stock and the mutual fund? A B D E F G H I J K Mutual fund Month/Ye ar LS&P 500 Mutual fund price FMAGX Stock price IBM Risk-free S&P 500 rate retum Stock return 1 2 return Market Stock Mutual risk risk fund risk premium premium premium 2015/12/1 3 4 2016/1/1 5 2016/2/1 6 2016/3/1 7 2016/4/1 8 2016/5/1 9 2016/6/1 10 2016/7/1 11 2016/8/1 12 2016/9/1 13 2016/10/1 14 2016/11/1 15 2016/12/1 16 2017/1/1 17 2017/2/1 18 2017/3/1 19 2017/4/1 20 2017/5/1 21 2017/6/1 22 2017/7/1 23 2017/8/1 24 2017/9/1 25 2017/10/1 26 2017/11/1 27 2017/12/1 28 2018/1/1 29 2018/2/1 B D E F G H I J K A 29 2018/2/1 30 2018/3/1 31 2018/4/1 32 2018/5/1 33 2018/6/1 34 2018/7/1 35 2018/8/1 36 2018/9/1 37 2018/10/1 38 2018/11/1 39 2018/12/1 40 2019/1/1 41 2019/2/1 42 2019/3/1 43 2019/4/1 44 2019/5/1 45 2019/6/1 46 2019/7/1 47 2019/8/1 48 2019/9/1 49 2019/10/1 50 2019/11/1 51 2019/12/1 52 2020/1/1 53 2020/2/1 54 2020/3/1 55 2020/4/1 56 2020/5/1 57 2020/6/1 58 2020/7/1 59 2020/8/1 60 2020/9/1 61 2020/10/1 62 2020/11/1
Step by Step Solution
There are 3 Steps involved in it

Get step-by-step solutions from verified subject matter experts