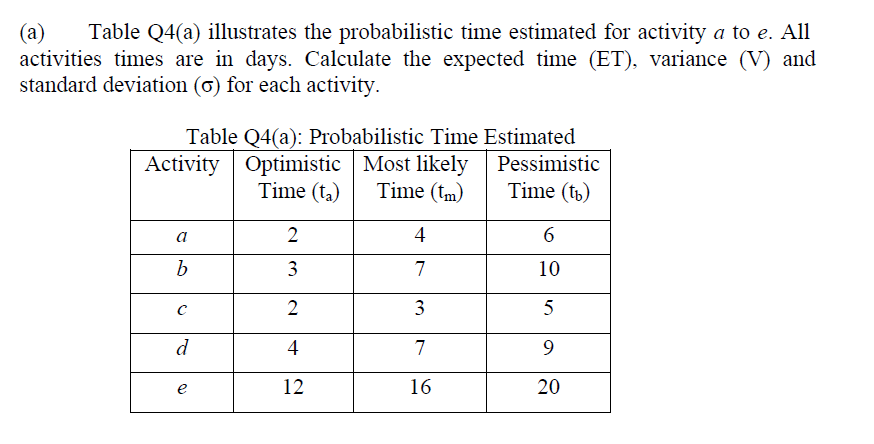
Question: how to do this question ? (a) Table Q4(a) illustrates the probabilistic time estimated for activity a to e. All activities times are in days.

how to do this question ?

how to do this question ? (a) Table Q4(a)

(a) Table Q4(a) illustrates the probabilistic time estimated for activity a to e. All activities times are in days. Calculate the expected time (ET), variance (V) and standard deviation (6) for each activity. Table Q4(a): Probabilistic Time Estimated Activity Optimistic Most likely Pessimistic Time (ta) Time (tm) Time (tu) 2 4 6 a b 3 7 10 2. 3 3 5 d 4. 7 9 e 12 16 20

Step by Step Solution

There are 3 Steps involved in it

1 Expert Approved Answer
Step: 1 Unlock blur-text-image
Question Has Been Solved by an Expert!

Get step-by-step solutions from verified subject matter experts

Step: 2 Unlock
Step: 3 Unlock

Students Have Also Explored These Related General Management Questions!