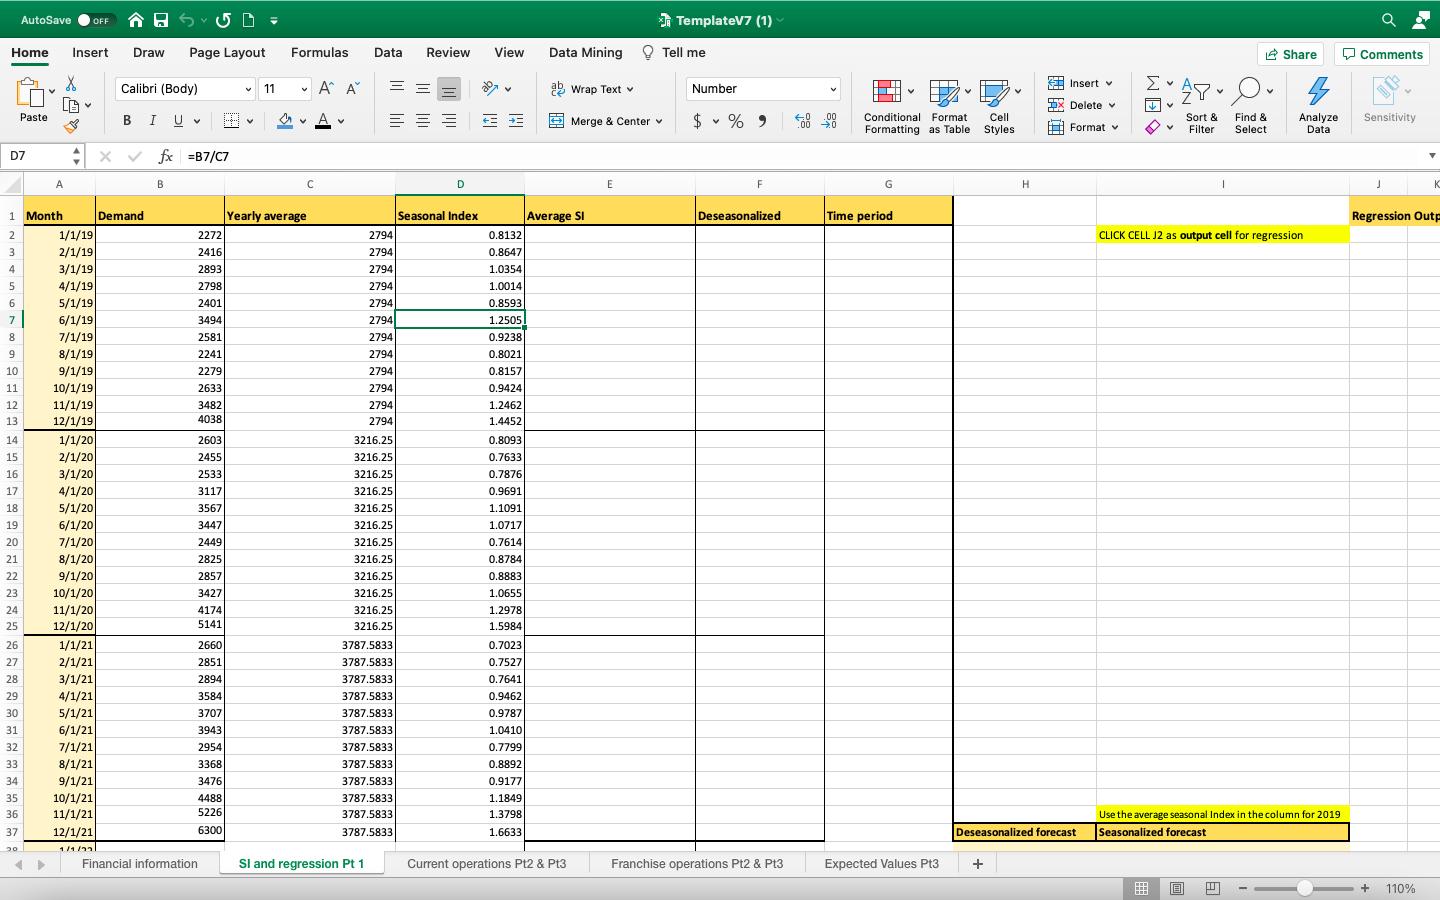
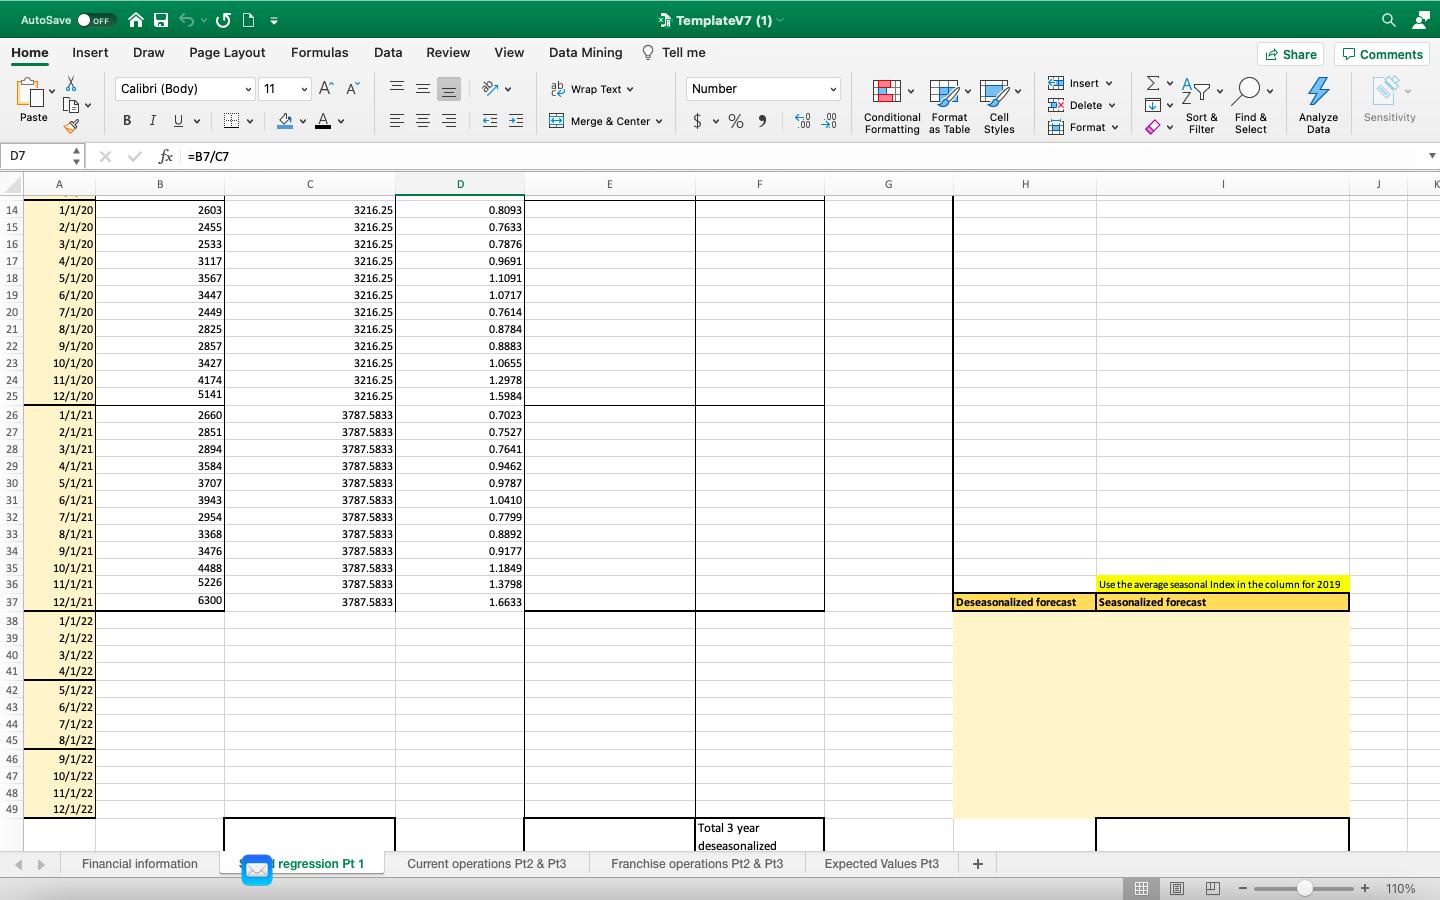
How to forecast the demand from 1/1/2022 to 12/1/2022 using the regression equation in excel? 5 L
Fantastic news! We've Found the answer you've been seeking!
Question:
Transcribed Image Text:
5 L Home Insert Draw Page Layout X 1 2 3 4 D7 5 6 7 8 9 10 11 12 13 14 15 16 17 18 19 20 21 22 23 24 25 26 27 28 29 30 31 32 33 34 35 36 37 AutoSave OFF 20 Paste B A Month A 1/1/19 2/1/19 3/1/19 4/1/19 5/1/19 6/1/19 7/1/19 8/1/19 9/1/19 10/1/19 11/1/19 12/1/19 1/1/20 2/1/20 3/1/20 4/1/20 5/1/20 6/1/20 7/1/20 8/1/20 9/1/20 10/1/20 11/1/20 12/1/20 1/1/21 2/1/21 3/1/21 4/1/21 5/1/21 6/1/21 7/1/21 8/1/21 9/1/21 10/1/21 11/1/21 12/1/21 1/1/77 Calibri (Body) BIU X fx =B7/C7 Demand B 2272 2416 2893 2798 2401 3494 2581 2241 2279 2633 3482 4038 2603 2455 2533 3117 3567 3447 2449 2825 2857 3427 4174 5141 2660 2851 2894 3584 3707 3943 2954 3368 3476 4488 5226 6300 Financial information. 11 Formulas Data Review - A^ A V A Yearly average == = = = 2794 2794 2794 2794 2794 2794 2794 2794 2794 2794 2794 2794 3216.25 3216.25 3216.25 3216.25 3216.25 3216.25 3216.25 3216.25 3216.25 3216.25 3216.25 3216.25 SI and regression Pt 1 3787.5833 3787.5833 3787.5833 3787.5833 3787.5833 3787.5833 3787.5833 3787.5833 3787.5833 3787.5833 3787.5833 3787.5833 D Seasonal Index View 207 0.8132 0.8647 1.0354 1.0014 0.8593 1.2505 0.9238 0.8021 0.8157 0.9424 1.2462 1.4452 0.8093 0.7633 0.7876 0.9691 1.1091 1.0717 0.7614 0.8784 0.8883 1.0655 1.2978 1.5984 0.7023 0.7527 0.7641 0.9462 0.9787 1.0410 0.7799 0.8892 0.9177 1.1849 1.3798 1.6633 Data Mining ab Wrap Text Average SI Current operations Pt2 & Pt3 Merge & Center v E TemplateV7 (1) Tell me Number $ % 9 V F Deseasonalized Franchise operations Pt2 & Pt3 .00 00 0 Conditional Format. Cell Formatting as Table Styles G Time period Expected Values Pt3 H + NO Insert v Delete Format v Deseasonalized forecast Dv 27.0 Sort & Find & Filter Select 1 0 CLICK CELL J2 as output cell for regression Use the average seasonal Index in the column for 2019 Seasonalized forecast 67 Share Lad Analyze Data - Comments Sensitivity J + 110% K Regression Outp 5 L Home Insert Draw Page Layout X 1 2 3 4 D7 5 6 7 8 9 10 11 12 13 14 15 16 17 18 19 20 21 22 23 24 25 26 27 28 29 30 31 32 33 34 35 36 37 AutoSave OFF 20 Paste B A Month A 1/1/19 2/1/19 3/1/19 4/1/19 5/1/19 6/1/19 7/1/19 8/1/19 9/1/19 10/1/19 11/1/19 12/1/19 1/1/20 2/1/20 3/1/20 4/1/20 5/1/20 6/1/20 7/1/20 8/1/20 9/1/20 10/1/20 11/1/20 12/1/20 1/1/21 2/1/21 3/1/21 4/1/21 5/1/21 6/1/21 7/1/21 8/1/21 9/1/21 10/1/21 11/1/21 12/1/21 1/1/77 Calibri (Body) BIU X fx =B7/C7 Demand B 2272 2416 2893 2798 2401 3494 2581 2241 2279 2633 3482 4038 2603 2455 2533 3117 3567 3447 2449 2825 2857 3427 4174 5141 2660 2851 2894 3584 3707 3943 2954 3368 3476 4488 5226 6300 Financial information. 11 Formulas Data Review - A^ A V A Yearly average == = = = 2794 2794 2794 2794 2794 2794 2794 2794 2794 2794 2794 2794 3216.25 3216.25 3216.25 3216.25 3216.25 3216.25 3216.25 3216.25 3216.25 3216.25 3216.25 3216.25 SI and regression Pt 1 3787.5833 3787.5833 3787.5833 3787.5833 3787.5833 3787.5833 3787.5833 3787.5833 3787.5833 3787.5833 3787.5833 3787.5833 D Seasonal Index View 207 0.8132 0.8647 1.0354 1.0014 0.8593 1.2505 0.9238 0.8021 0.8157 0.9424 1.2462 1.4452 0.8093 0.7633 0.7876 0.9691 1.1091 1.0717 0.7614 0.8784 0.8883 1.0655 1.2978 1.5984 0.7023 0.7527 0.7641 0.9462 0.9787 1.0410 0.7799 0.8892 0.9177 1.1849 1.3798 1.6633 Data Mining ab Wrap Text Average SI Current operations Pt2 & Pt3 Merge & Center v E TemplateV7 (1) Tell me Number $ % 9 V F Deseasonalized Franchise operations Pt2 & Pt3 .00 00 0 Conditional Format. Cell Formatting as Table Styles G Time period Expected Values Pt3 H + NO Insert v Delete Format v Deseasonalized forecast Dv 27.0 Sort & Find & Filter Select 1 0 CLICK CELL J2 as output cell for regression Use the average seasonal Index in the column for 2019 Seasonalized forecast 67 Share Lad Analyze Data - Comments Sensitivity J + 110% K Regression Outp
Expert Answer:
Answer rating: 100% (QA)
To forecast the demand from 112022 to 1212022 using a regression equation in Excel you would typically follow these steps 1 Gather and Prepare Data En... View the full answer
Related Book For
Posted Date:
Students also viewed these accounting questions
-
If the focal length of a lens is 3 centimeters and the image distance is 5 centimeters from the lens, what is the distance from the object to the lens?
-
A manufacturer purchases a part for use at both of its plants-one at Roseville, California, the other at Akron, Ohio. The part is available in limited quantities from two suppliers. Each supplier has...
-
What type of motor would you specify for a meat grinder if the motor is to be exposed?
-
On January 1, 2008, the S&P 500 index stood at 1468 with a price-to-book ratio of 2.6. Expected earnings for the index for calendar year 2008 were 72.56. These earnings estimates, compiled from...
-
In Exercises 2532, find an nth-degree polynomial function with real coefficients satisfying the given conditions. If you are using a graphing utility, use it to graph the function and verify the real...
-
Allan and Koraev both owned condominiums in the same building. Koraevs unit was directly above Allans. While Allan lived in her own unit, Koraev leased his. The leasing of Koraevs unit was managed by...
-
The bookkeeper for Andy's Country Music Bar went insane and left this incomplete balance sheet. Andy's working capital is $95,000 and its debt to assets ratio is 40 percent. Required Complete the...
-
During the early 19th century, the Springfield (Massachu-setts) Armory provided a good example of: an increasing division of labor accounting techniques for wage payments and control of time and...
-
Let X be the winnings of a gambler. Let p(i) = P(X = i) and suppose that Compute the conditional probability that the gambler wins i , i = 1, 2, 3, given that he wins a positive amount. 1/3: p(1) %3...
-
On January 1, 2021, Eegle Company borrows $23.000 cash by signing a four-year, 9% installiment note The note requires four equal payments of $7,099. consisting of eccrued interest and principal on...
-
Name 10 widely used instructional methods.
-
There are two basic types of stock market index. a. The Dow Jones Industrial Average is a price-weighted index. b. The S&P 500 is a value-weighted index. c. For every stock market in the world, there...
-
What accounts for the disparity in NPMO between the statistical 6 and the popular Six Sigma approach?
-
There are several ways to value stocks. a. Some analysts examine patterns of past performance; others follow investor psychology. b. The fundamental value of a stock depends on expectations for a...
-
If a video game costs $30 in the United States and 27 in the United Kingdom, what is the real video game exchange rate? Look up the current dollarpound exchange rate and compare the two prices. What...
-
Nezuko needs a wooden plank for a broken side of her wooden box. She knows that the area of a side of a wooden plank measures 36a^(2)b- 42a^(3)b^(2)cm^(2). Help her find the dimensions of the wooden...
-
During 2012, Cheng Book Store paid $483,000 for land and built a store in Georgetown. Prior to construction, the city of Georgetown charged Cheng $1,300 for a building permit, which Cheng paid. Cheng...
-
Calculate the value for the test statistic, x2_, for each of these situations: . : dr-20. n-15,S-17.8 b, H0: 2-30, n-18, s-5.7 c. Ho: 42, 25,s 37.8 d. H,:12, 37, s 163
-
a. What is a sampling distribution of sample means? b. A sample of size 3 is taken from a population, and the sample mean is found. Describe how this sample mean is related to the sampling...
-
Draw a scatter diagram for these data: Would you be justified in using the techniques of linear regression on these data to find the line of best fit? Explain. 5 2 4 2 5 3 2 2 5
-
A researcher measured heart rate \((x)\) and oxygen uptake \((y)\) for one person under varying exercise conditions. He wishes to determine if heart rate, which is easier to measure, can be used to...
-
A researcher is investigating the relationship between yield of potatoes \((y)\) and level of fertilizer \((x\).\() She divides a eld into eight plots of equal\) size and applied fertilizer at a di...
-
The Police Department is interested in determining the e ect of alcohol consumption on driving performance. Twelve male drivers of similar weight, age, and driving experience were randomly assigned...
Study smarter with the SolutionInn App