

The Police Department is interested in determining the e ect of alcohol consumption on driving performance. Twelve
Question:
The Police Department is interested in determining the e ect of alcohol consumption on driving performance. Twelve male drivers of similar weight, age, and driving experience were randomly assigned to three groups of four. The rst group consumed two cans of beer within 30 minutes, the second group consumed four cans of beer within 30 minutes, and the third group was the control and did not consume any beer. Twenty minutes later, each of the twelve took a driving test under the same conditions, and their individual scores were recorded. (The higher the score, the better the driving performance.) The results were:
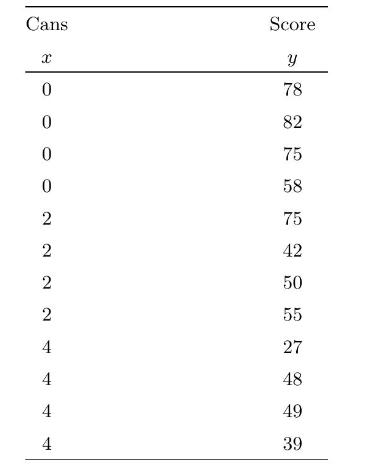
(a) Plot a scatterplot of score versus cans.
(b) Calculate the parameters of the least squares line.
(c) Graph the least squares line on your scatterplot.
(d) Calculate the estimated variance about the least squares line.
(e) Suppose we know that the driving score given the number of cans of beer drunk is normal \(\left(0+x^{2}\right)\), where \({ }^{2}=12^{2}\) is known. Use a \(\operatorname{normal}\left(010^{2}\right)\) prior for . What is the posterior distribution of ?
(f) Find a \(95 \%\) credible interval for .
(g) Perform a Bayesian test of
\[
H_{0}: \quad 0 \text { versus } H_{1}:\]
at the \(5 \%\) level of signi cance.
(h) Find the predictive distribution for the \(y_{13}\) the driving score of the next male who will be tested after drinking \(x_{13}=3\) cans of beer.
(i) Find a \(95 \%\) credible interval for the prediction.
Step by Step Answer:

This question has not been answered yet.
You can Ask your question!

Introduction To Bayesian Statistics
ISBN: 9781118091562
3rd Edition
Authors: William M. Bolstad, James M. Curran
