

Question: How to interpret the regression analysis, thank you. e C Table 5.1: Regression analysis result (Experimental Group) Independent variable Dependent variablet Purchase Intention Standardized Coefficients
How to interpret the regression analysis, thank you.
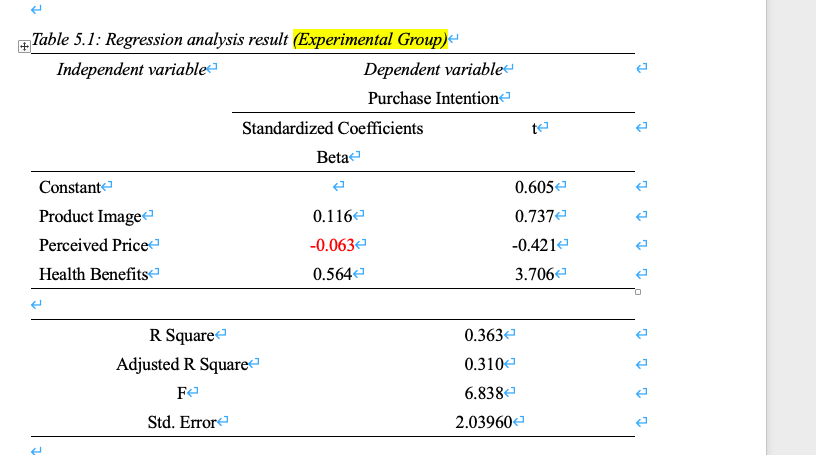
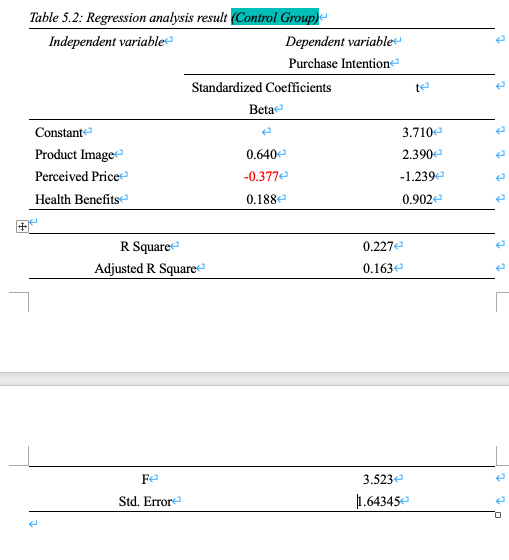
e C Table 5.1: Regression analysis result (Experimental Group) Independent variable Dependent variablet Purchase Intention Standardized Coefficients Beta Constant 0.6052 Product Image 0.1162 0.7372 Perceived Price -0.063e -0.421e Health Benefits 0.5642 3.706 C e 0.3632 0.310 R Square Adjusted R Square Fe Std. Error 6.8382 * * 1 t 2.03960 Table 5.2: Regression analysis result Control Group) Independent variable Dependent variable Purchase Intention Standardized Coefficients Beta Constante 3.710 Product Image 0.640 2.390 Perceived Price -0.377e -1.239 Health Benefits 0.188 0.902 R Square Adjusted R Square 0.227 0.163 Fe 3.523e 11.64345 Std. ErroreStep by Step Solution
There are 3 Steps involved in it
1 Expert Approved Answer
Step: 1 Unlock

Question Has Been Solved by an Expert!
Get step-by-step solutions from verified subject matter experts
Step: 2 Unlock
Step: 3 Unlock