

Question: how to solve? Decide, what pattern are these distributions. Use the quadrat analysis for the first diagram and the nearest neighbour analysis for the second
how to solve?
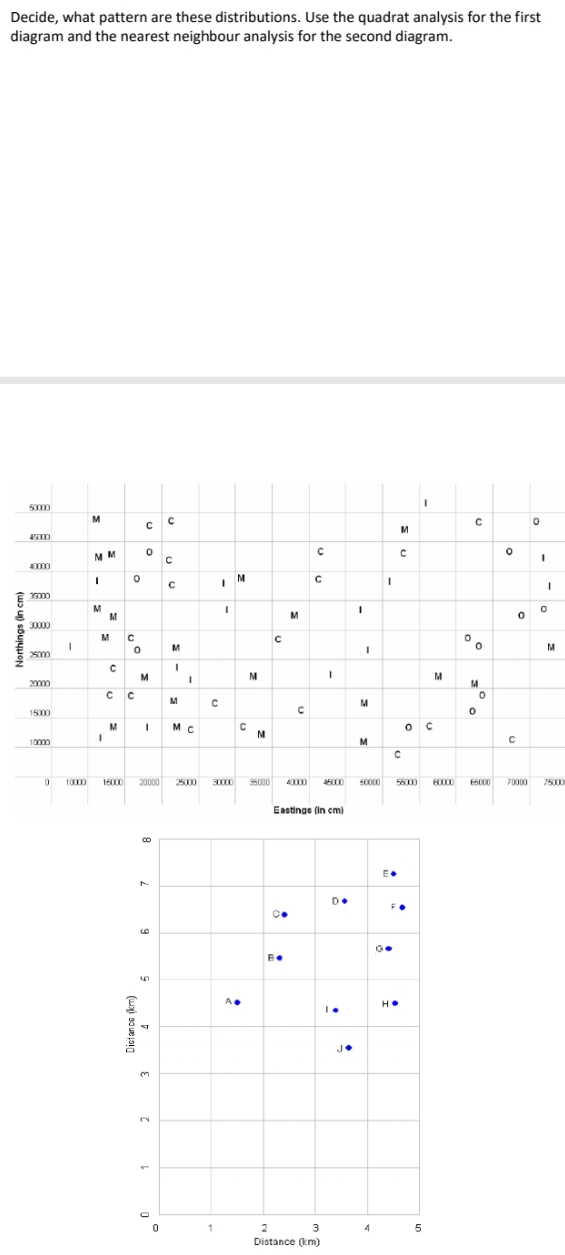
Decide, what pattern are these distributions. Use the quadrat analysis for the first diagram and the nearest neighbour analysis for the second diagram. C C C C C Northings (in cm) M 5000 C M C C C M 10100 C C 10800 16000 20000 25000 30000 35000 40030 45000 90000 56000 60000 65000 70000 75000 Eastings (In cmi CO D. F Co GO H . I . Dictan co (kmm) J m 2 3 4 5 Distance (km)
Step by Step Solution
There are 3 Steps involved in it
1 Expert Approved Answer
Step: 1 Unlock

Question Has Been Solved by an Expert!
Get step-by-step solutions from verified subject matter experts
Step: 2 Unlock
Step: 3 Unlock