

Question: how to solve problem (b)?? More Info Use Pareto analysis to investigate the data collected on a printed-circuit-board assembly line. Click the icon to view
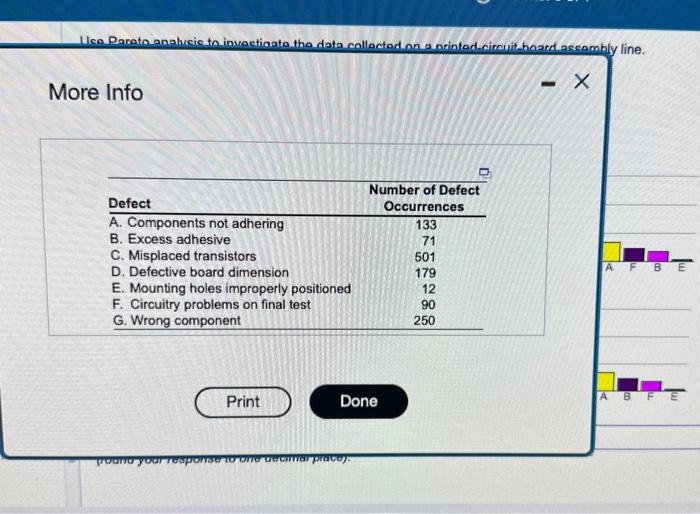
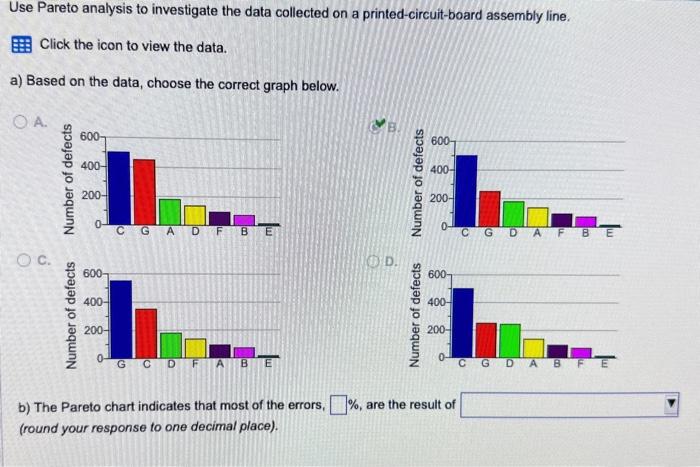
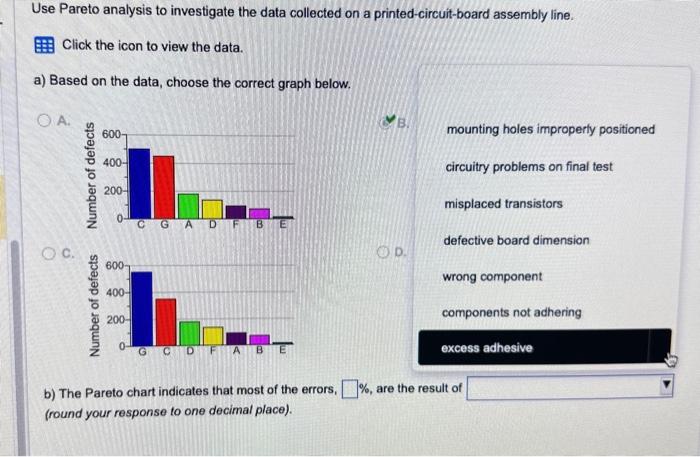
More Info Use Pareto analysis to investigate the data collected on a printed-circuit-board assembly line. Click the icon to view the data. a) Based on the data, choose the correct graph below. A. c. b) The Pareto chart indicates that most of the errors, %, are the result of (round your response to one decimal place). Use Pareto analysis to investigate the data collected on a printed-circuit-board assembly line. Click the icon to view the data. a) Based on the data, choose the correct graph below. A C. b) The Pareto chart indicates that most of the errors, \%, are the result of (round your response to one decimal place). More Info Use Pareto analysis to investigate the data collected on a printed-circuit-board assembly line. Click the icon to view the data. a) Based on the data, choose the correct graph below. A. c. b) The Pareto chart indicates that most of the errors, %, are the result of (round your response to one decimal place). Use Pareto analysis to investigate the data collected on a printed-circuit-board assembly line. Click the icon to view the data. a) Based on the data, choose the correct graph below. A C. b) The Pareto chart indicates that most of the errors, \%, are the result of (round your response to one decimal place)
Step by Step Solution
There are 3 Steps involved in it

Get step-by-step solutions from verified subject matter experts