

Question: How to solve scatterplots and linear models ? Practi HW 8: Scatterplots & Linear Models the inf Vehicle Registrations owing Vehicle Registrations in the United
How to solve scatterplots and linear models ?
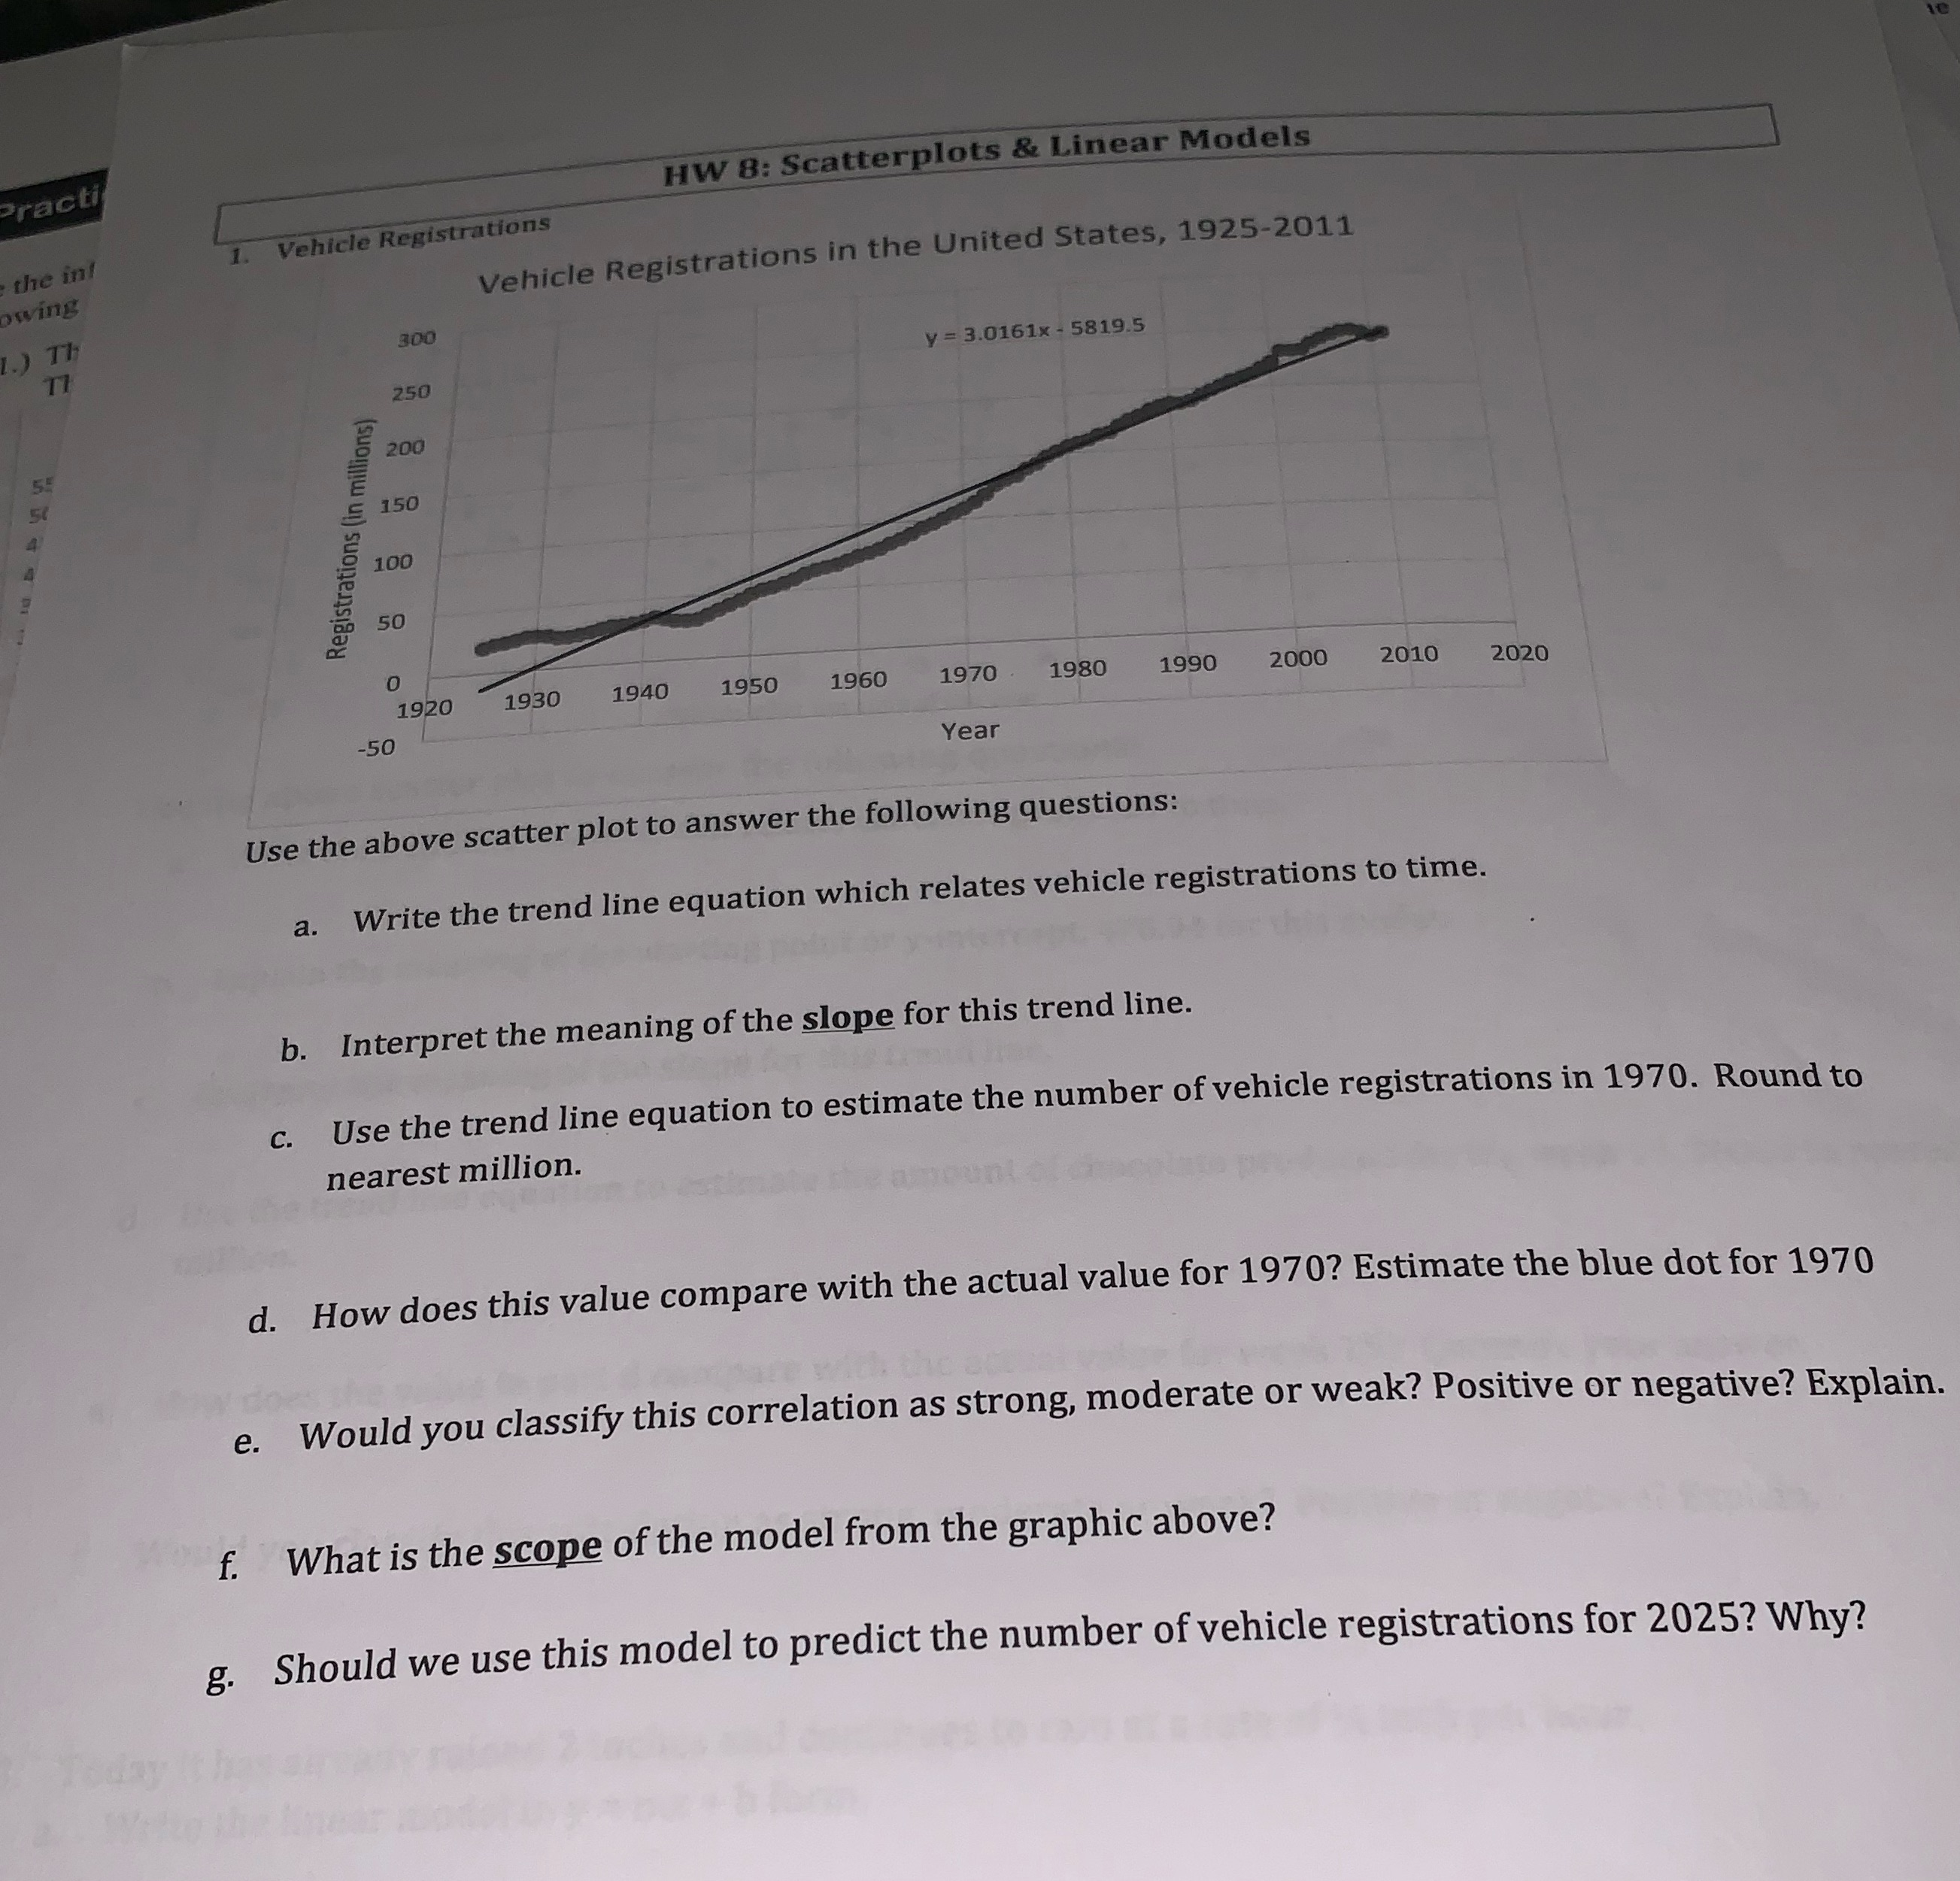
Practi HW 8: Scatterplots & Linear Models the inf Vehicle Registrations owing Vehicle Registrations in the United States, 1925-2011 1.) TF 300 y = 3.0161x - 5819.5 250 5 200 n milli 150 9 100 Registrations 50 0 1920 1930 1940 1950 1960 1970 1980 1990 2000 2010 2020 -50 Year Use the above scatter plot to answer the following questions: a. Write the trend line equation which relates vehicle registrations to time. b. Interpret the meaning of the slope for this trend line. c. Use the trend line equation to estimate the number of vehicle registrations in 1970. Round to nearest million. d. How does this value compare with the actual value for 1970? Estimate the blue dot for 1970 e. Would you classify this correlation as strong, moderate or weak? Positive or negative? Explain. f. What is the scope of the model from the graphic above? g. Should we use this model to predict the number of vehicle registrations for 2025? Why
Step by Step Solution
There are 3 Steps involved in it

Get step-by-step solutions from verified subject matter experts