

Question: How to solve this? Some data with the smallest observation 18 and argest observation 73 are described by the density 0.5- histogram shown. Construct a
How to solve this?
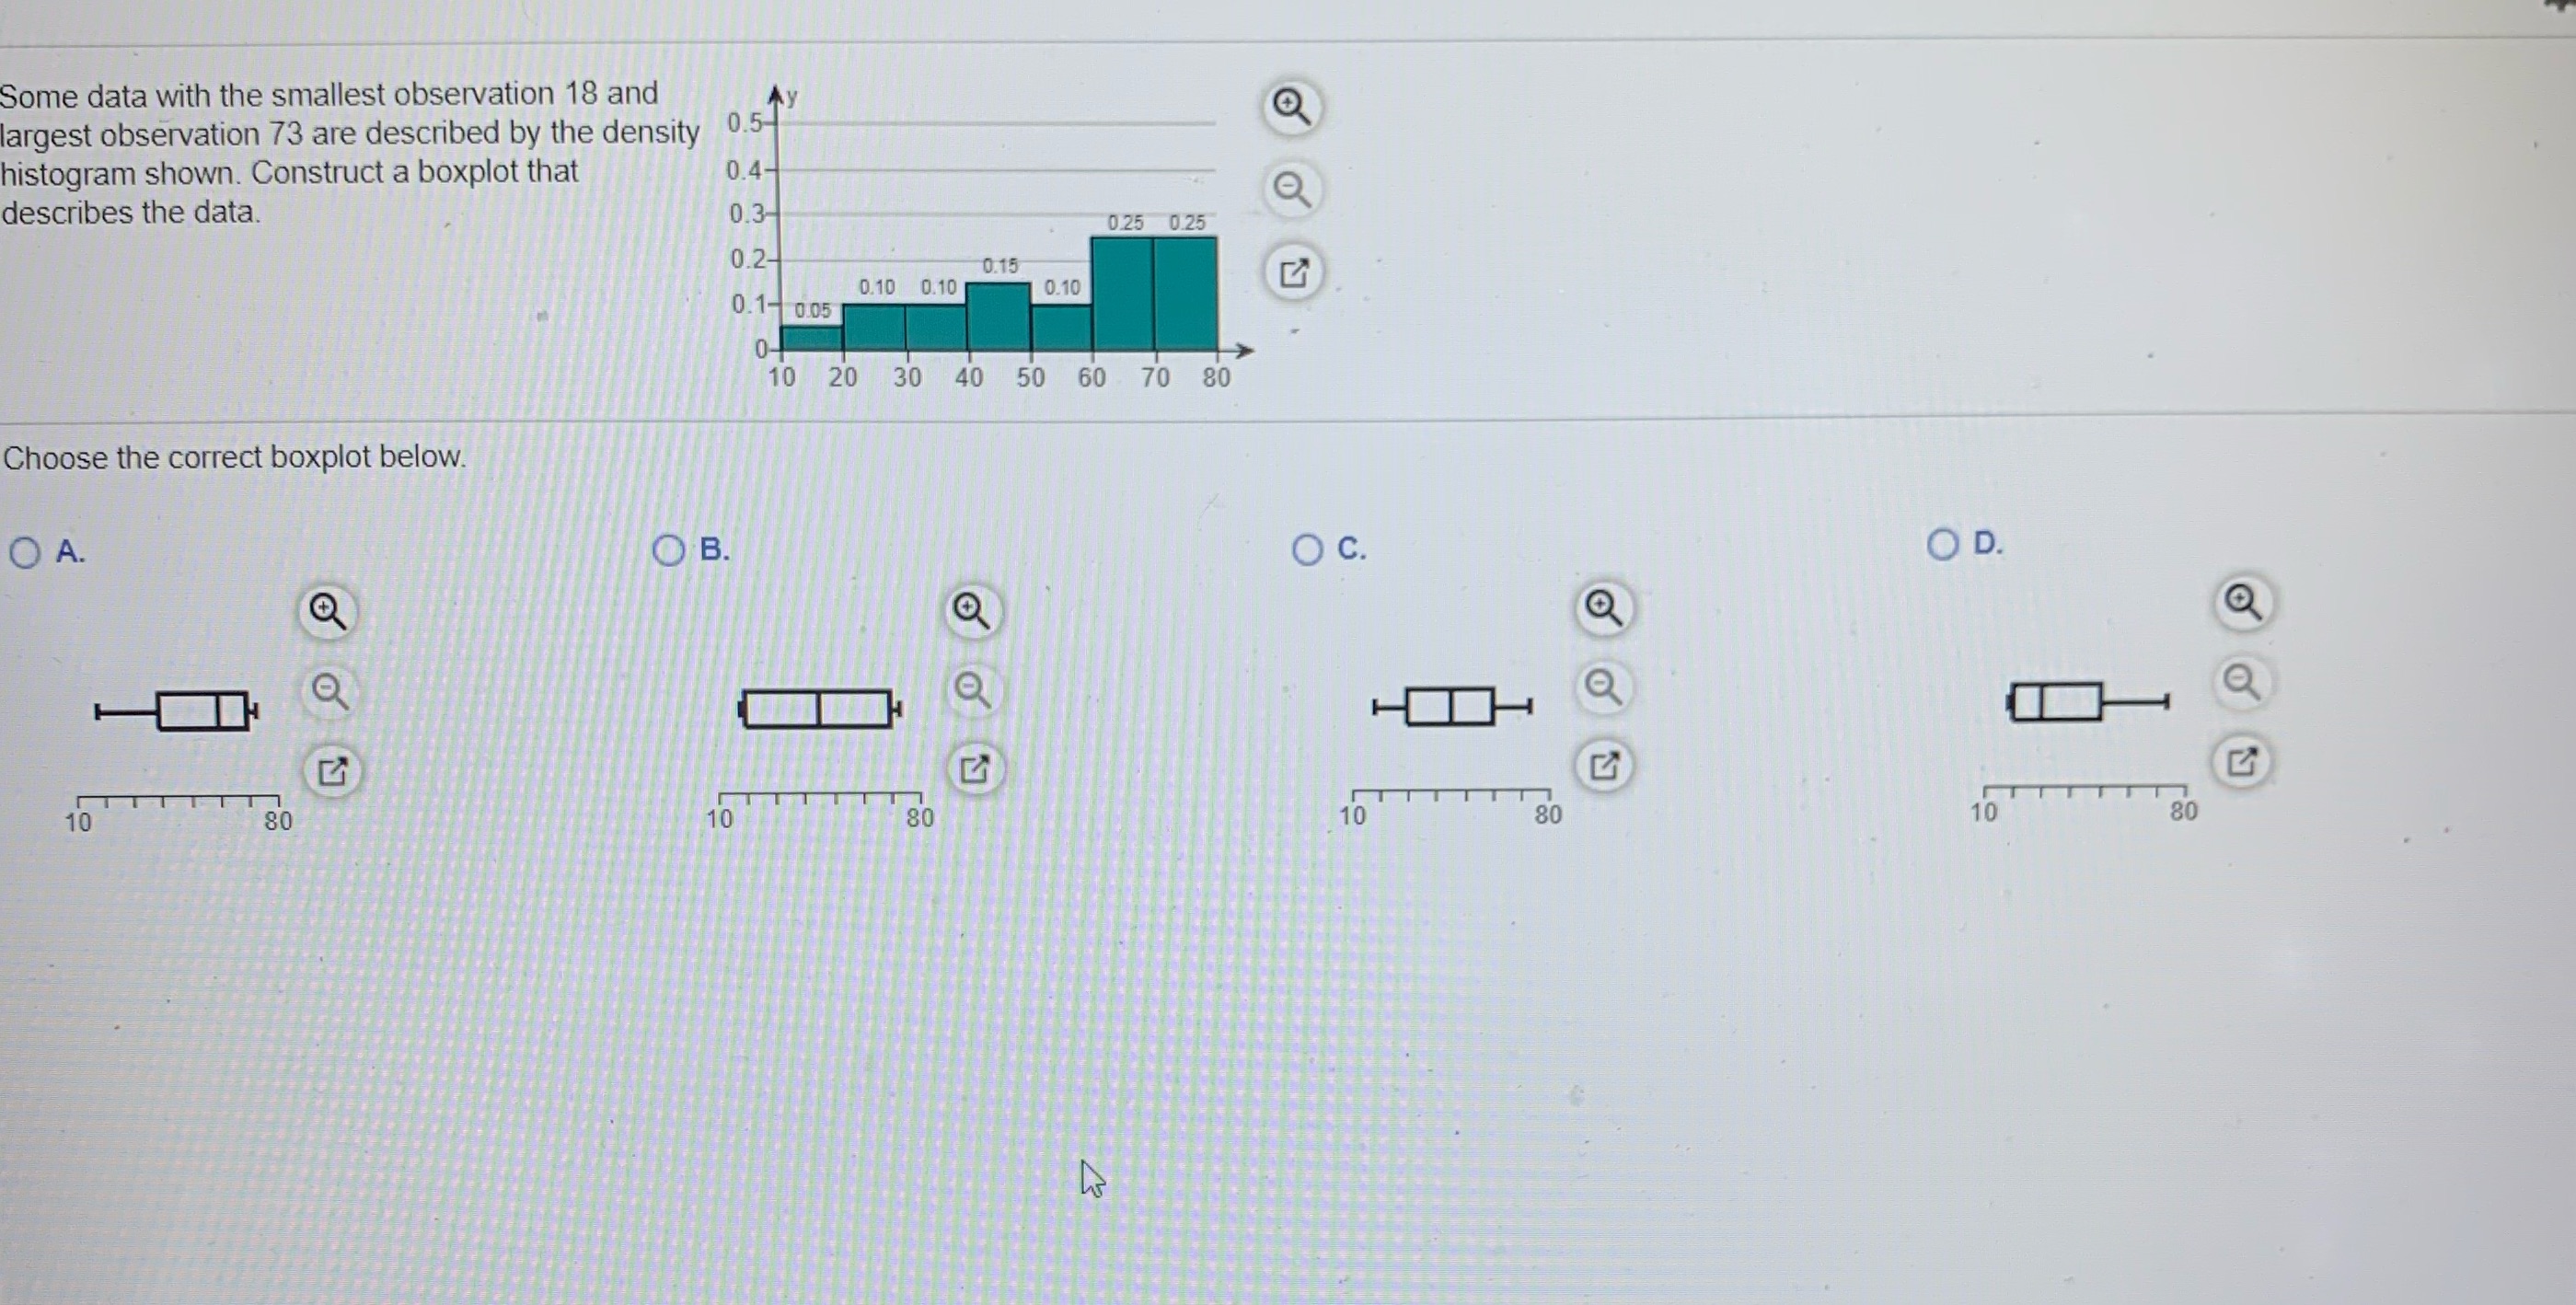
Some data with the smallest observation 18 and argest observation 73 are described by the density 0.5- histogram shown. Construct a boxplot that 0.4- describes the data. 0.3 0.25 0.25 0.2- 0.15 0.10 0.10 0.10 0.1- 0.05 0- 10 20 30 40 50 60 70 80 Choose the correct boxplot below. O A. O B. O C. OD. 10 80 10 80 10 ITTTT 80 80
Step by Step Solution
There are 3 Steps involved in it
1 Expert Approved Answer
Step: 1 Unlock

Question Has Been Solved by an Expert!
Get step-by-step solutions from verified subject matter experts
Step: 2 Unlock
Step: 3 Unlock