

Question: How to use PSPP to complete lab? You will be using the following variables in this assignment. If you have not already done so, rename
How to use PSPP to complete lab?
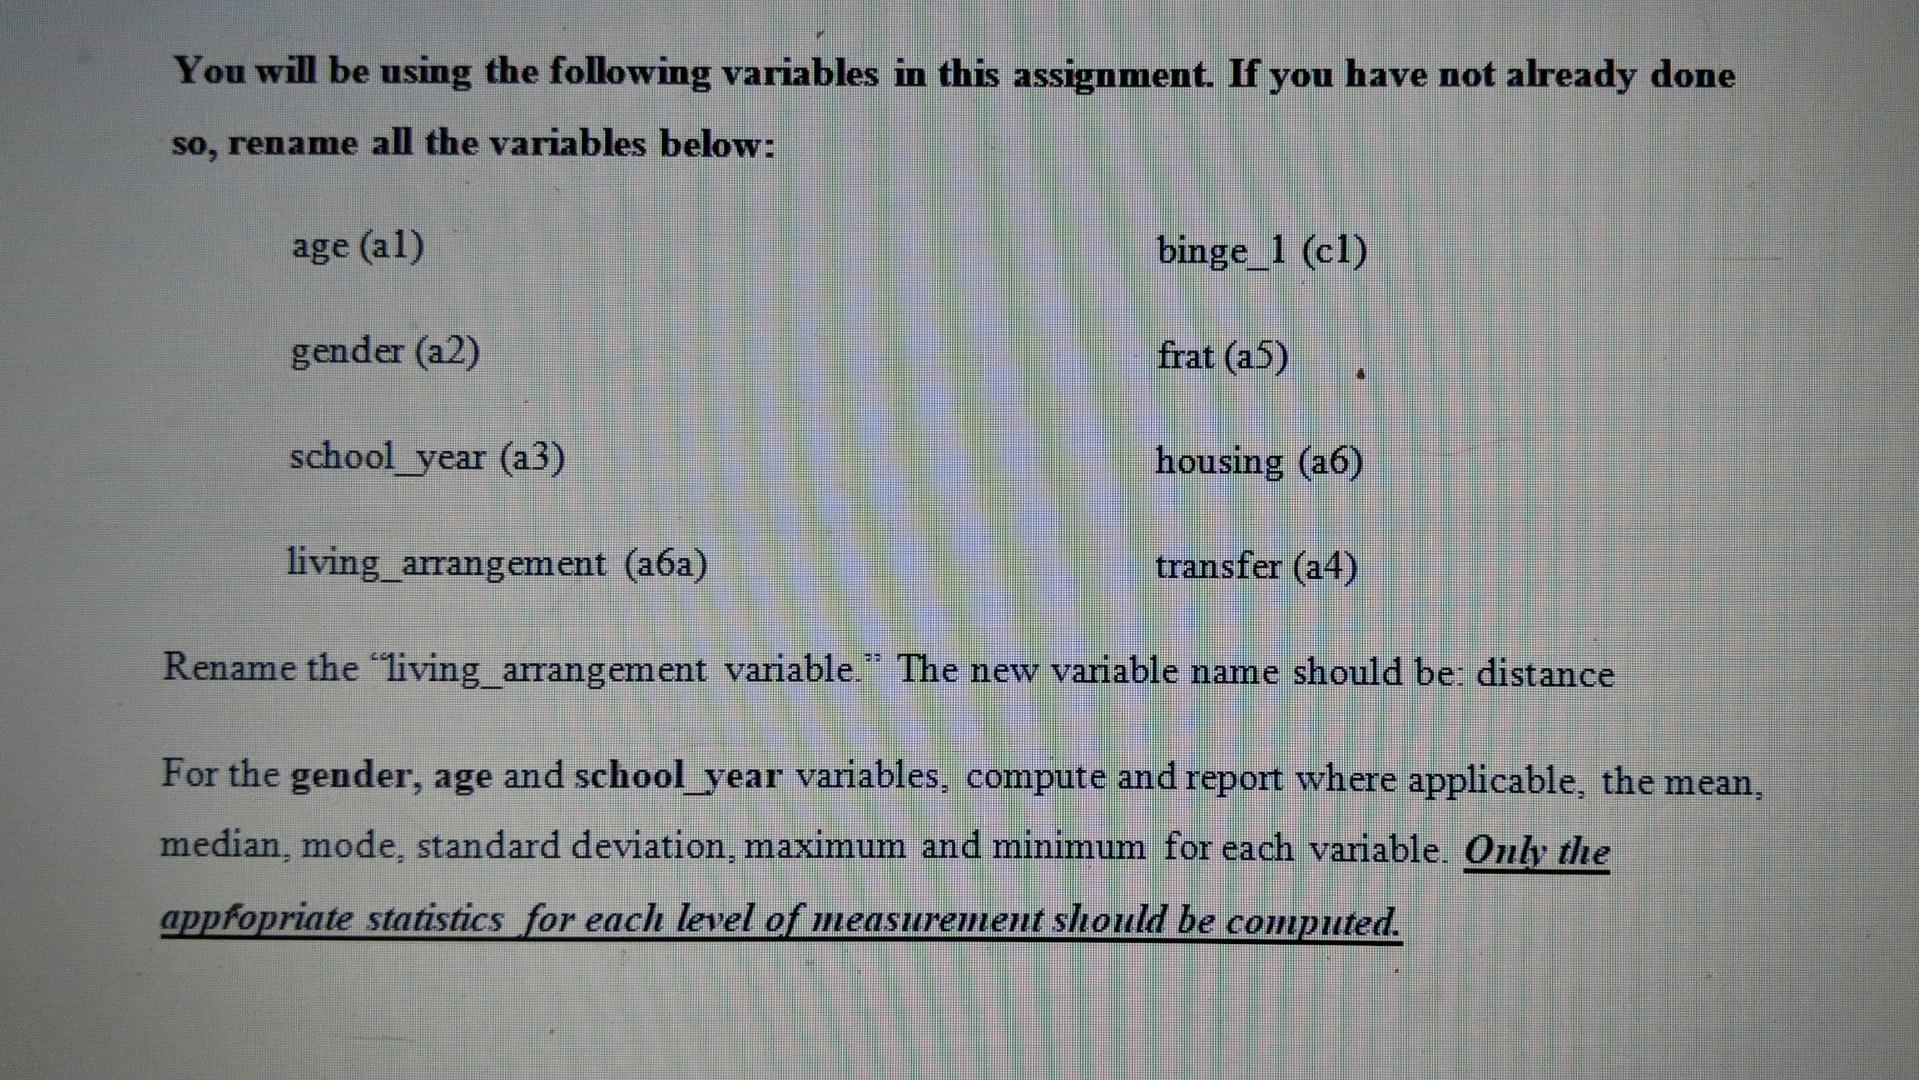
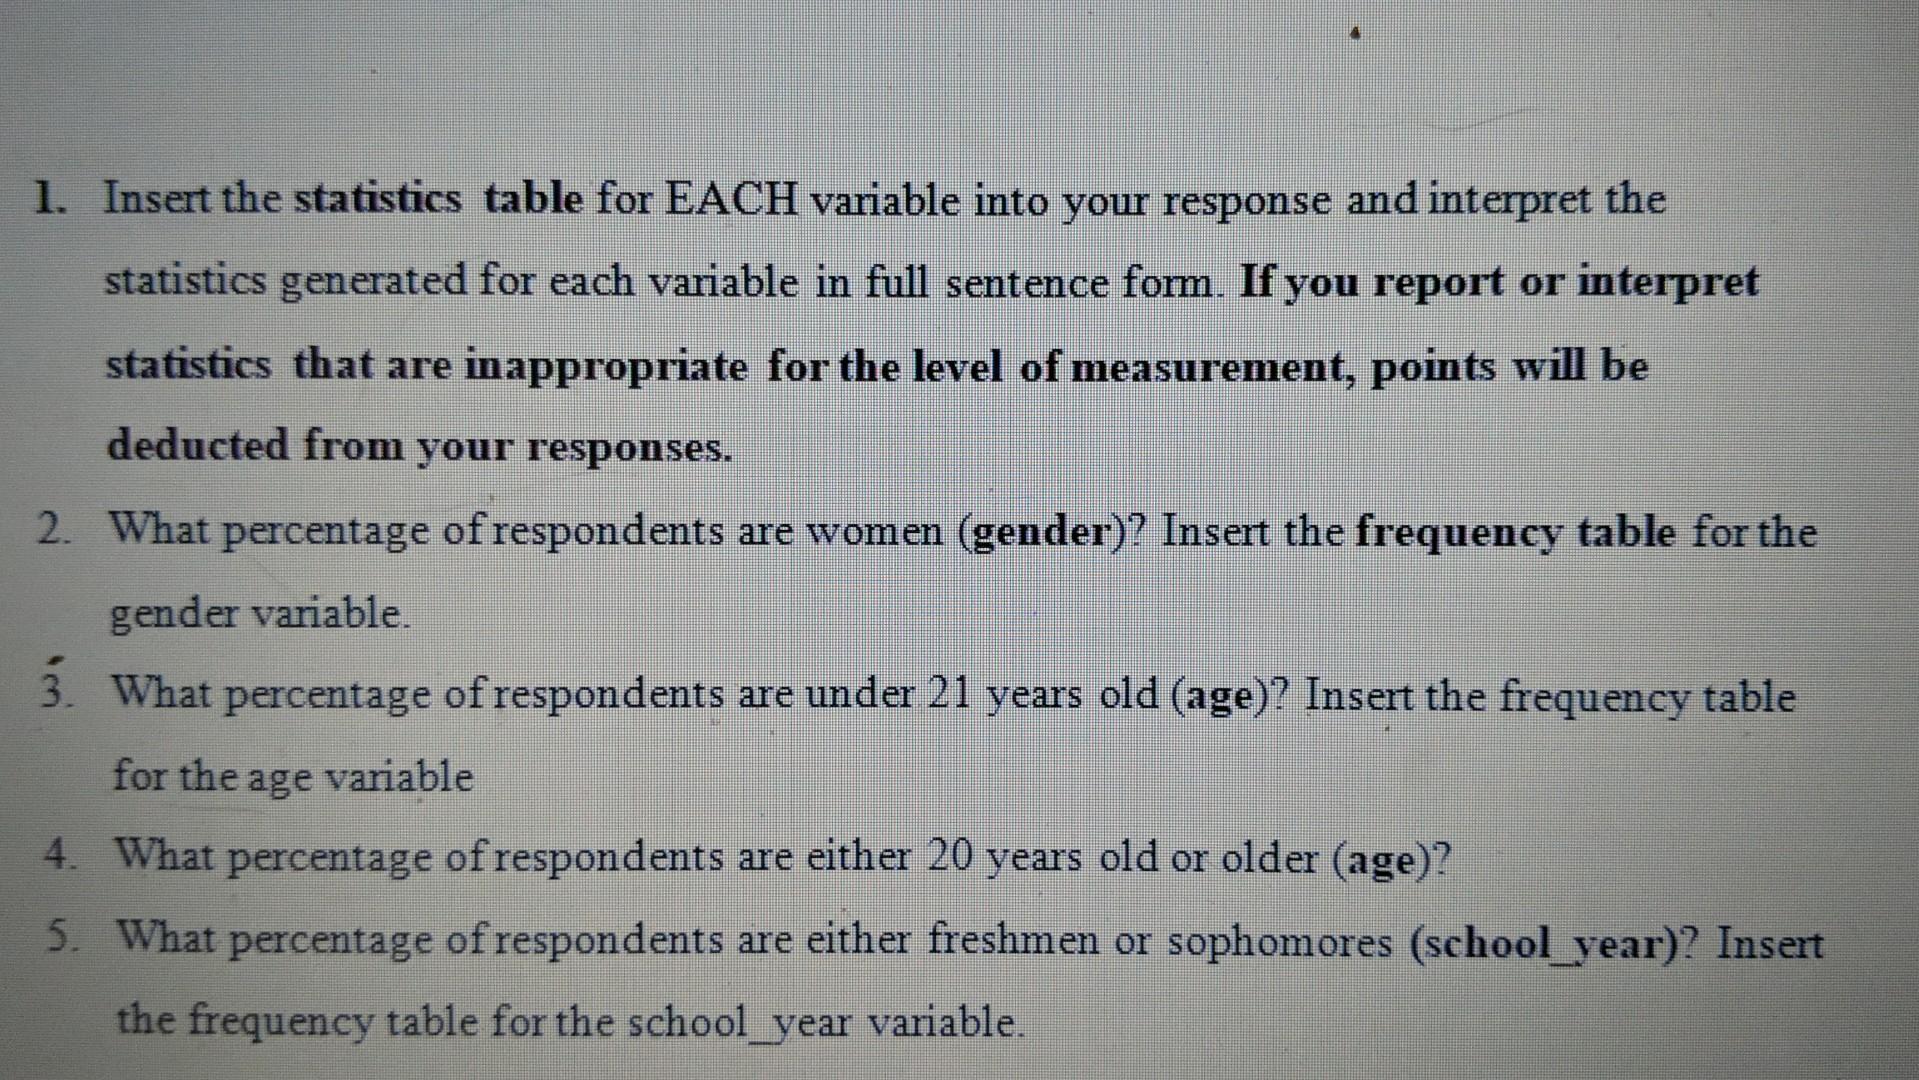
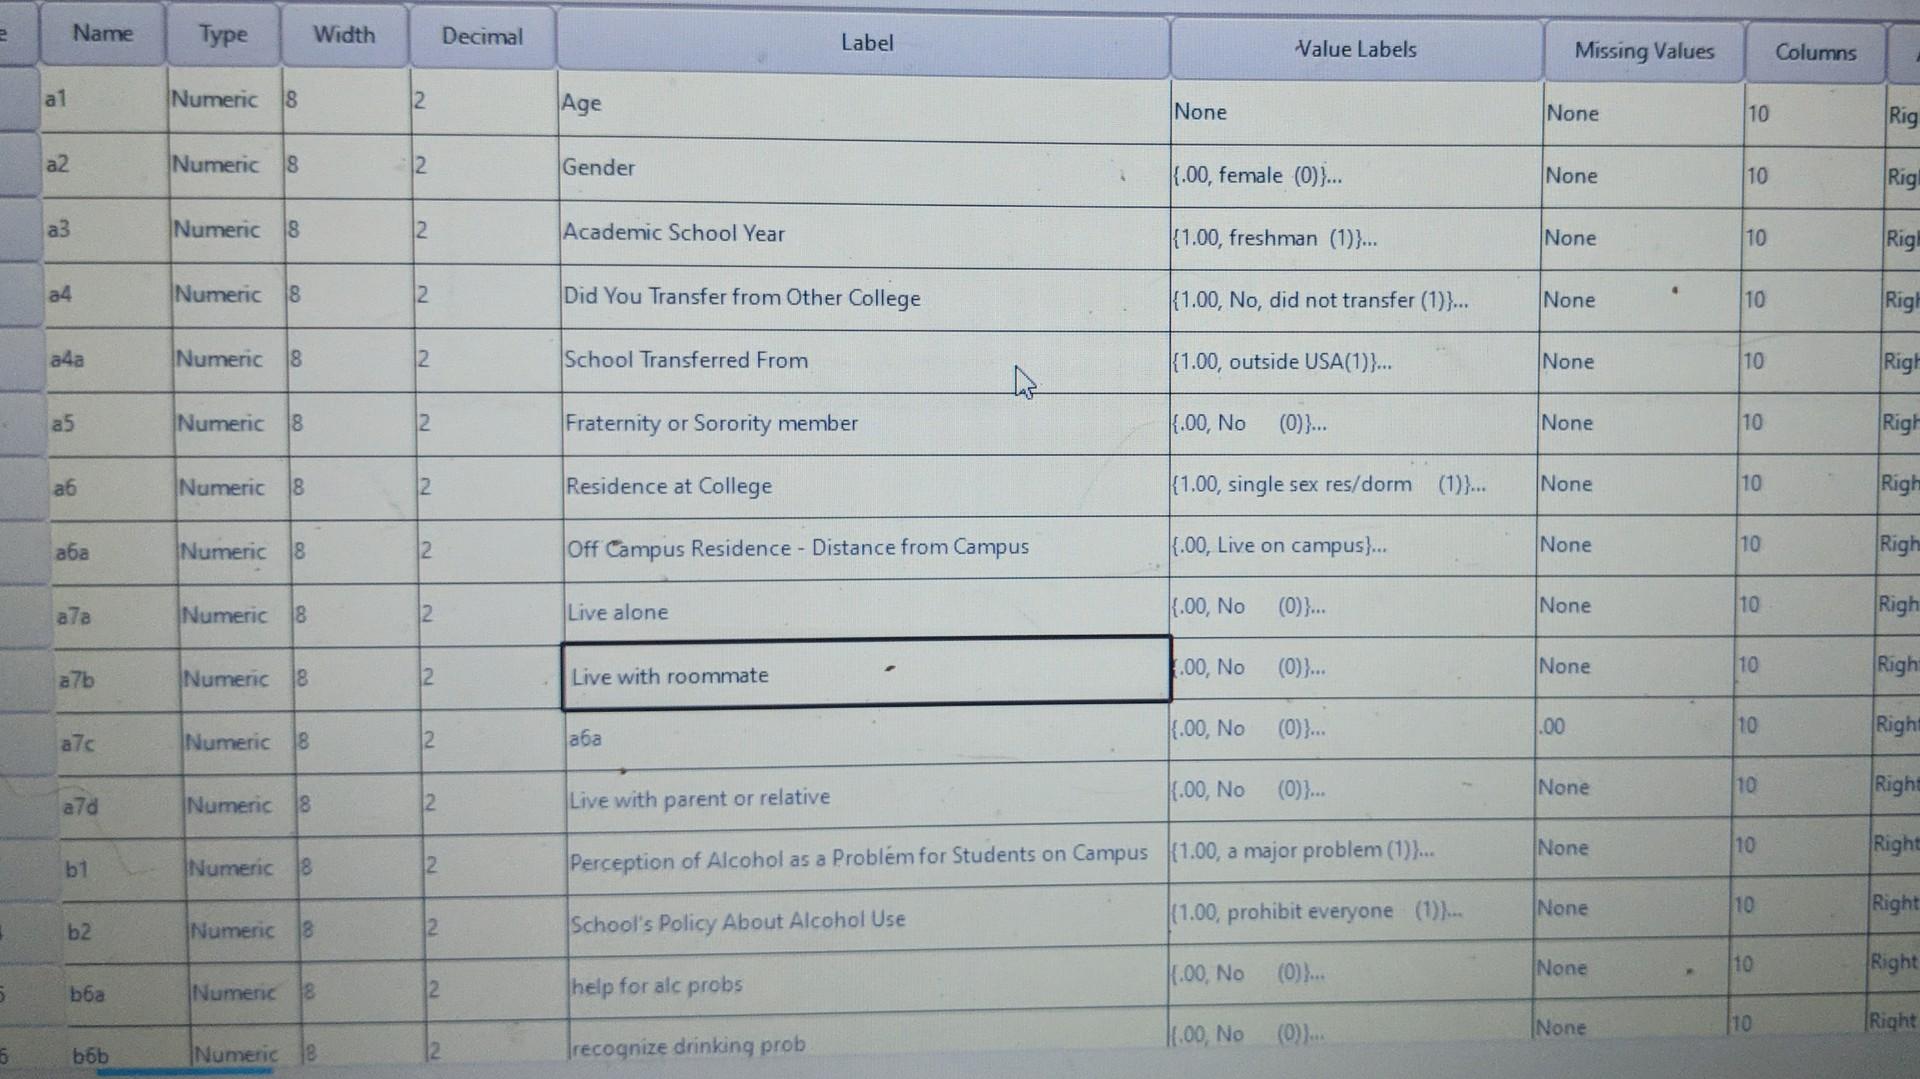
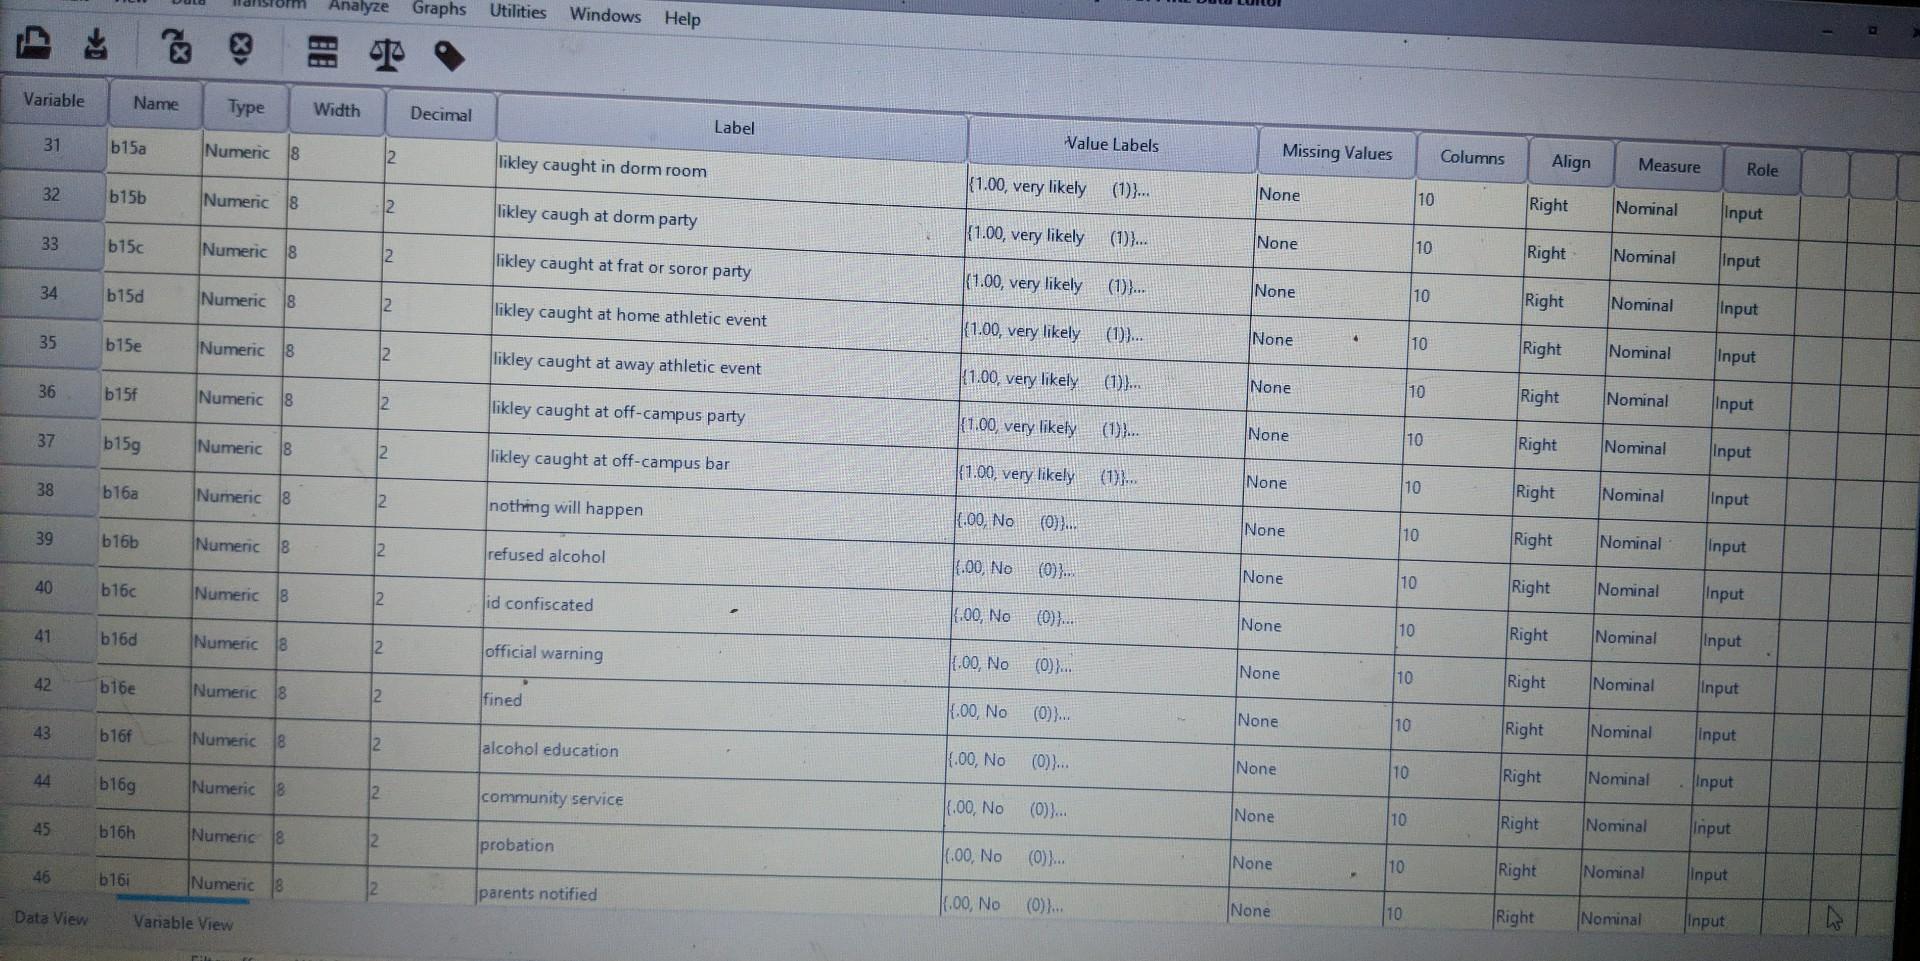
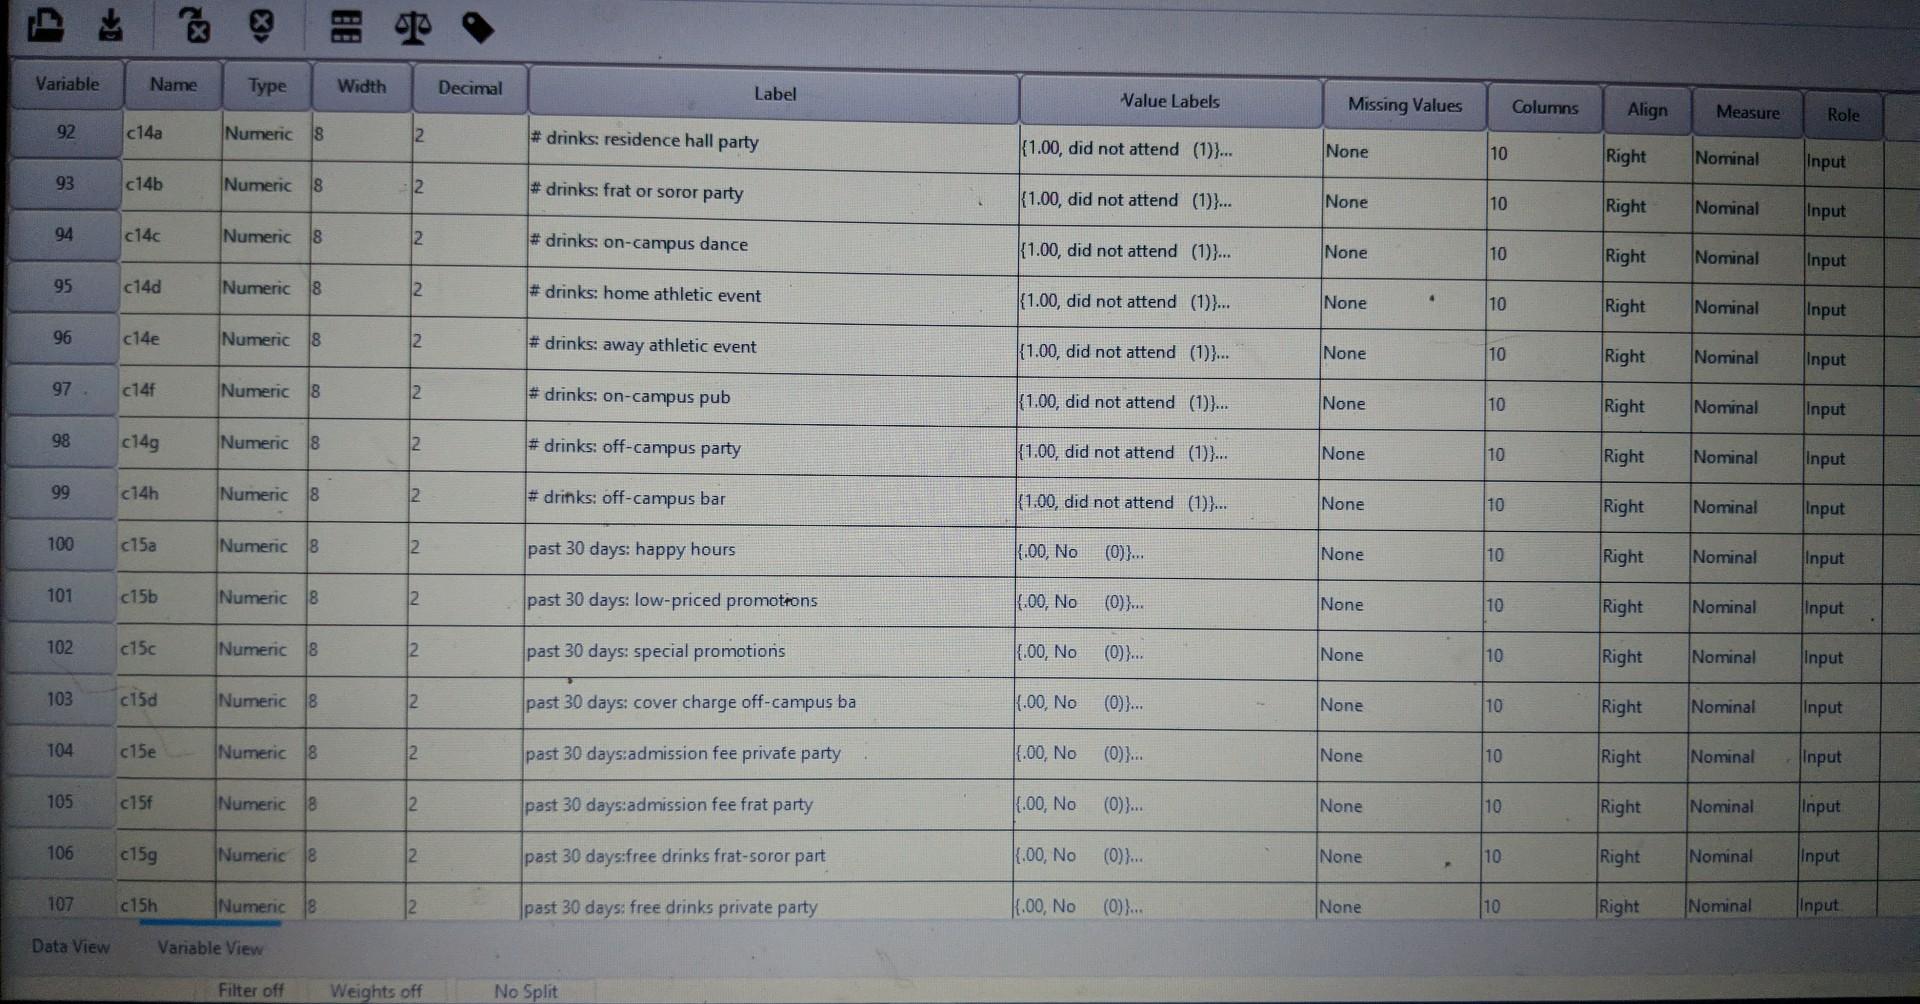
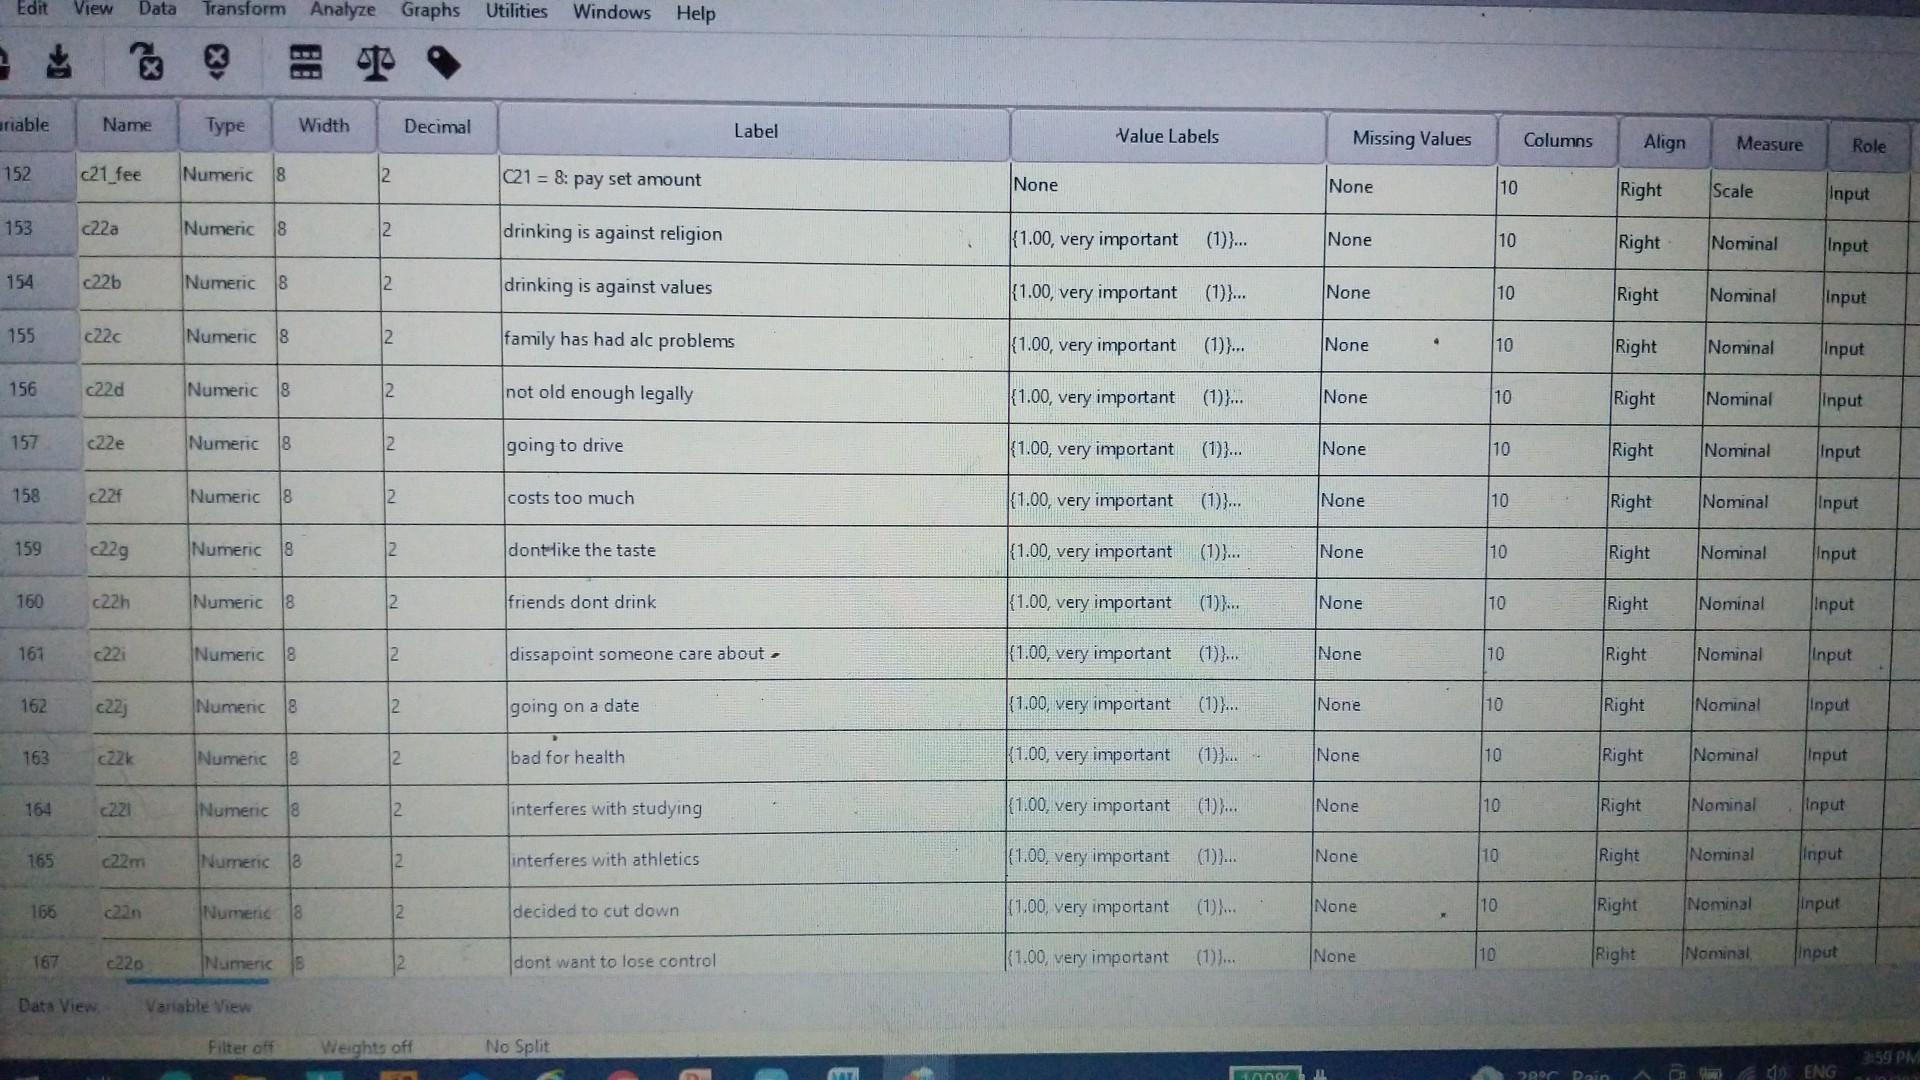
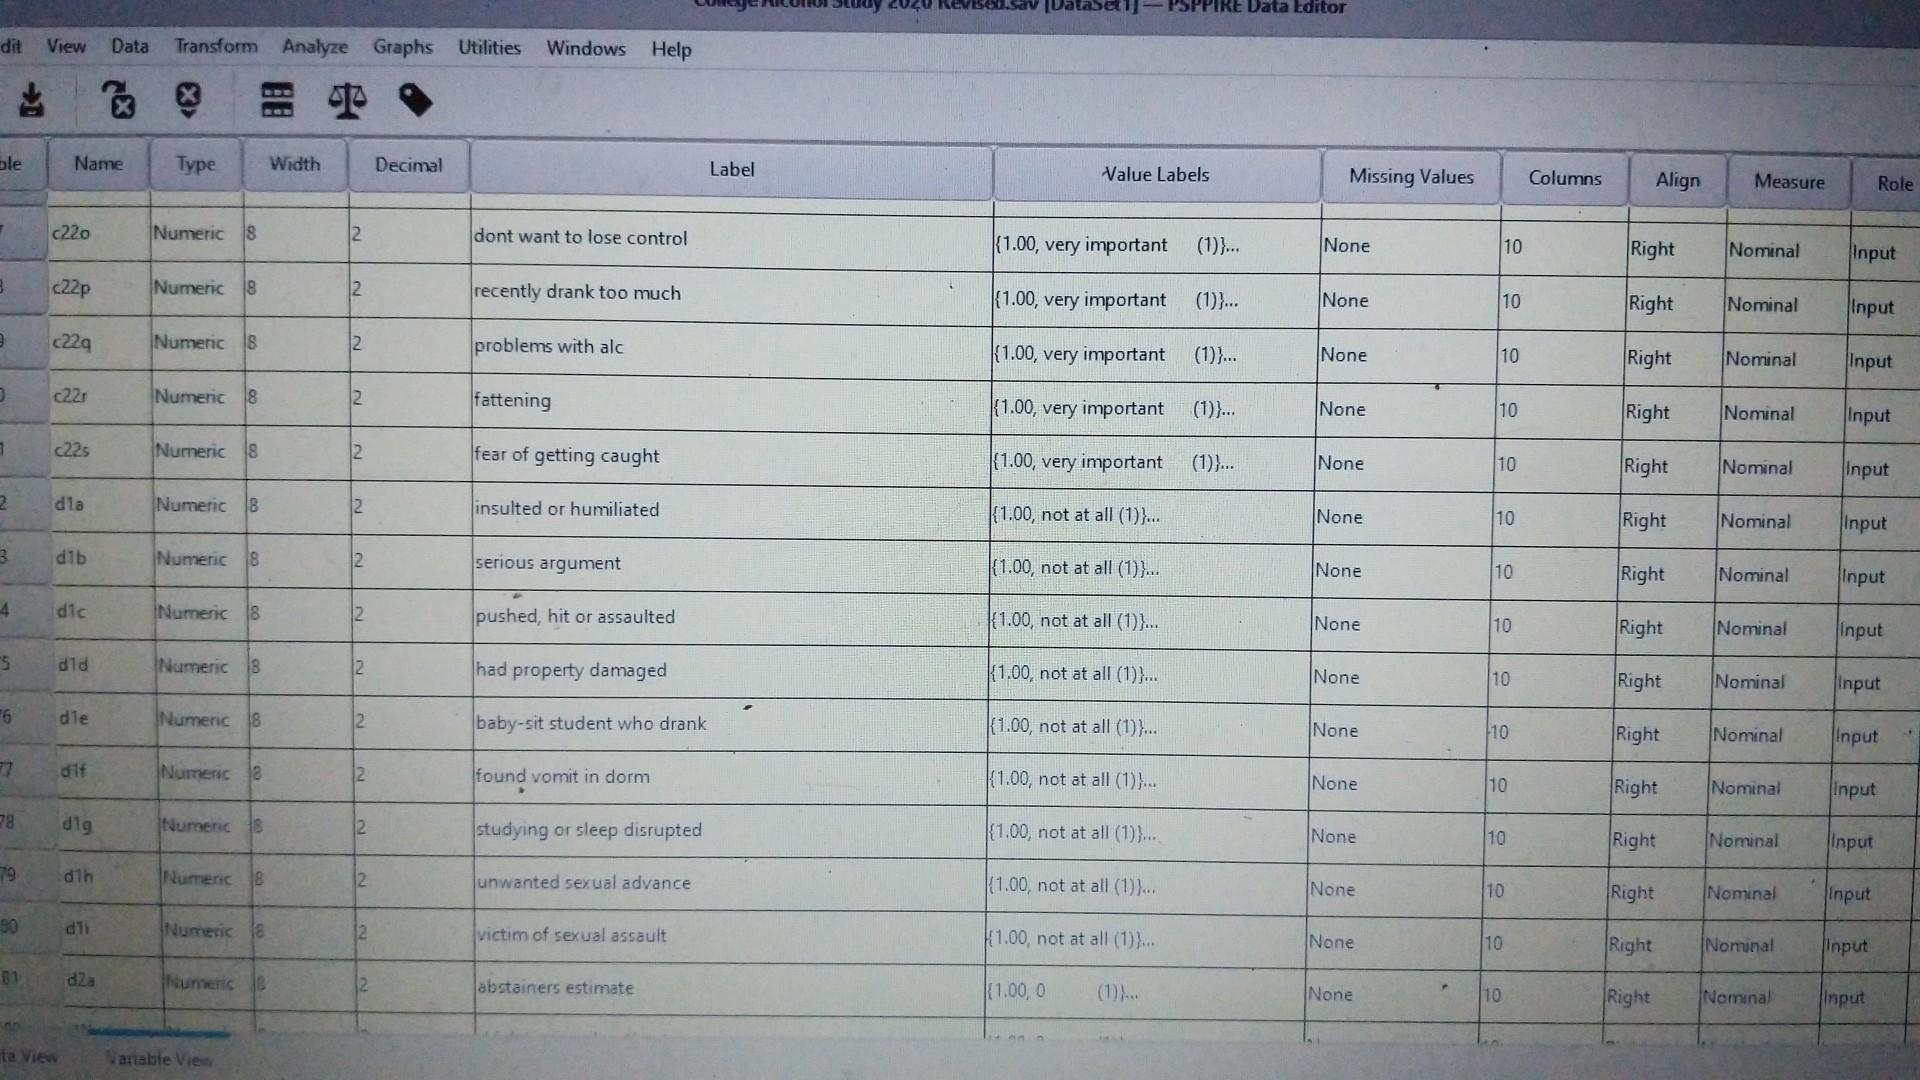
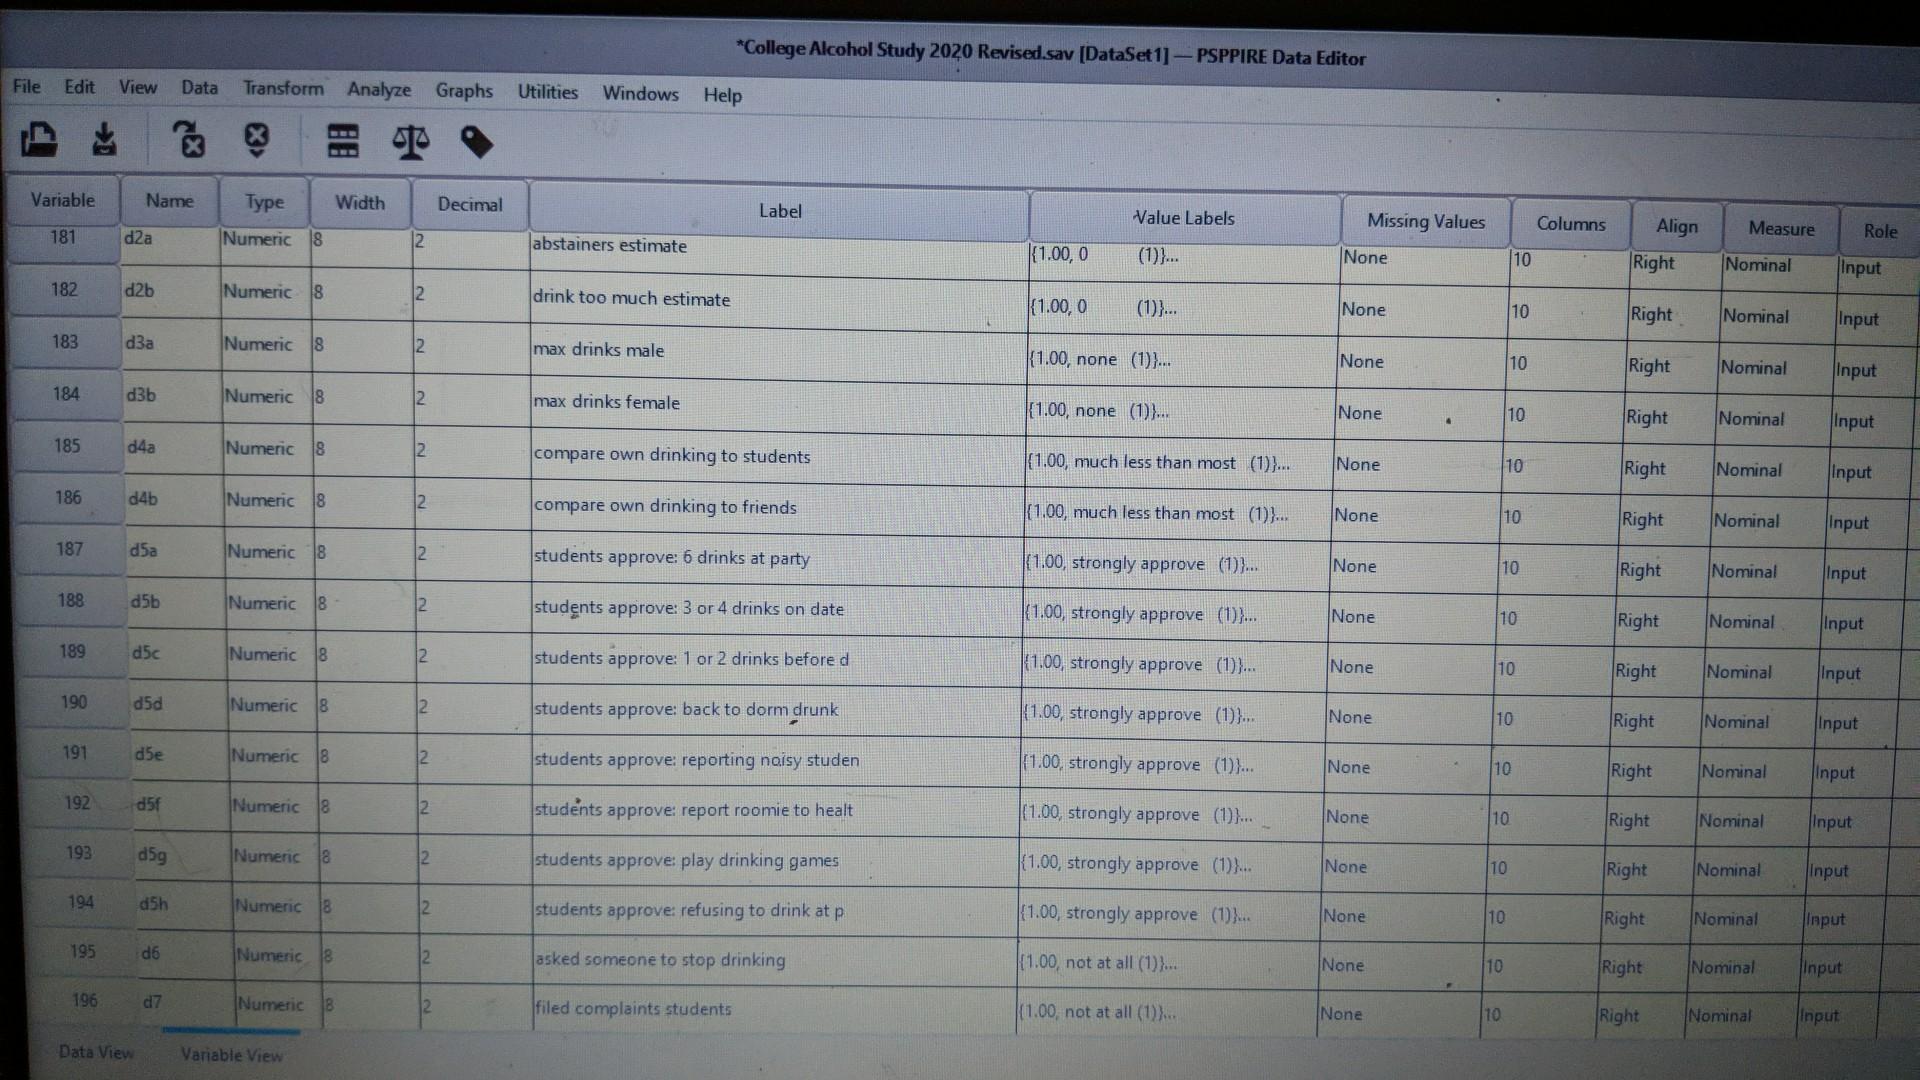
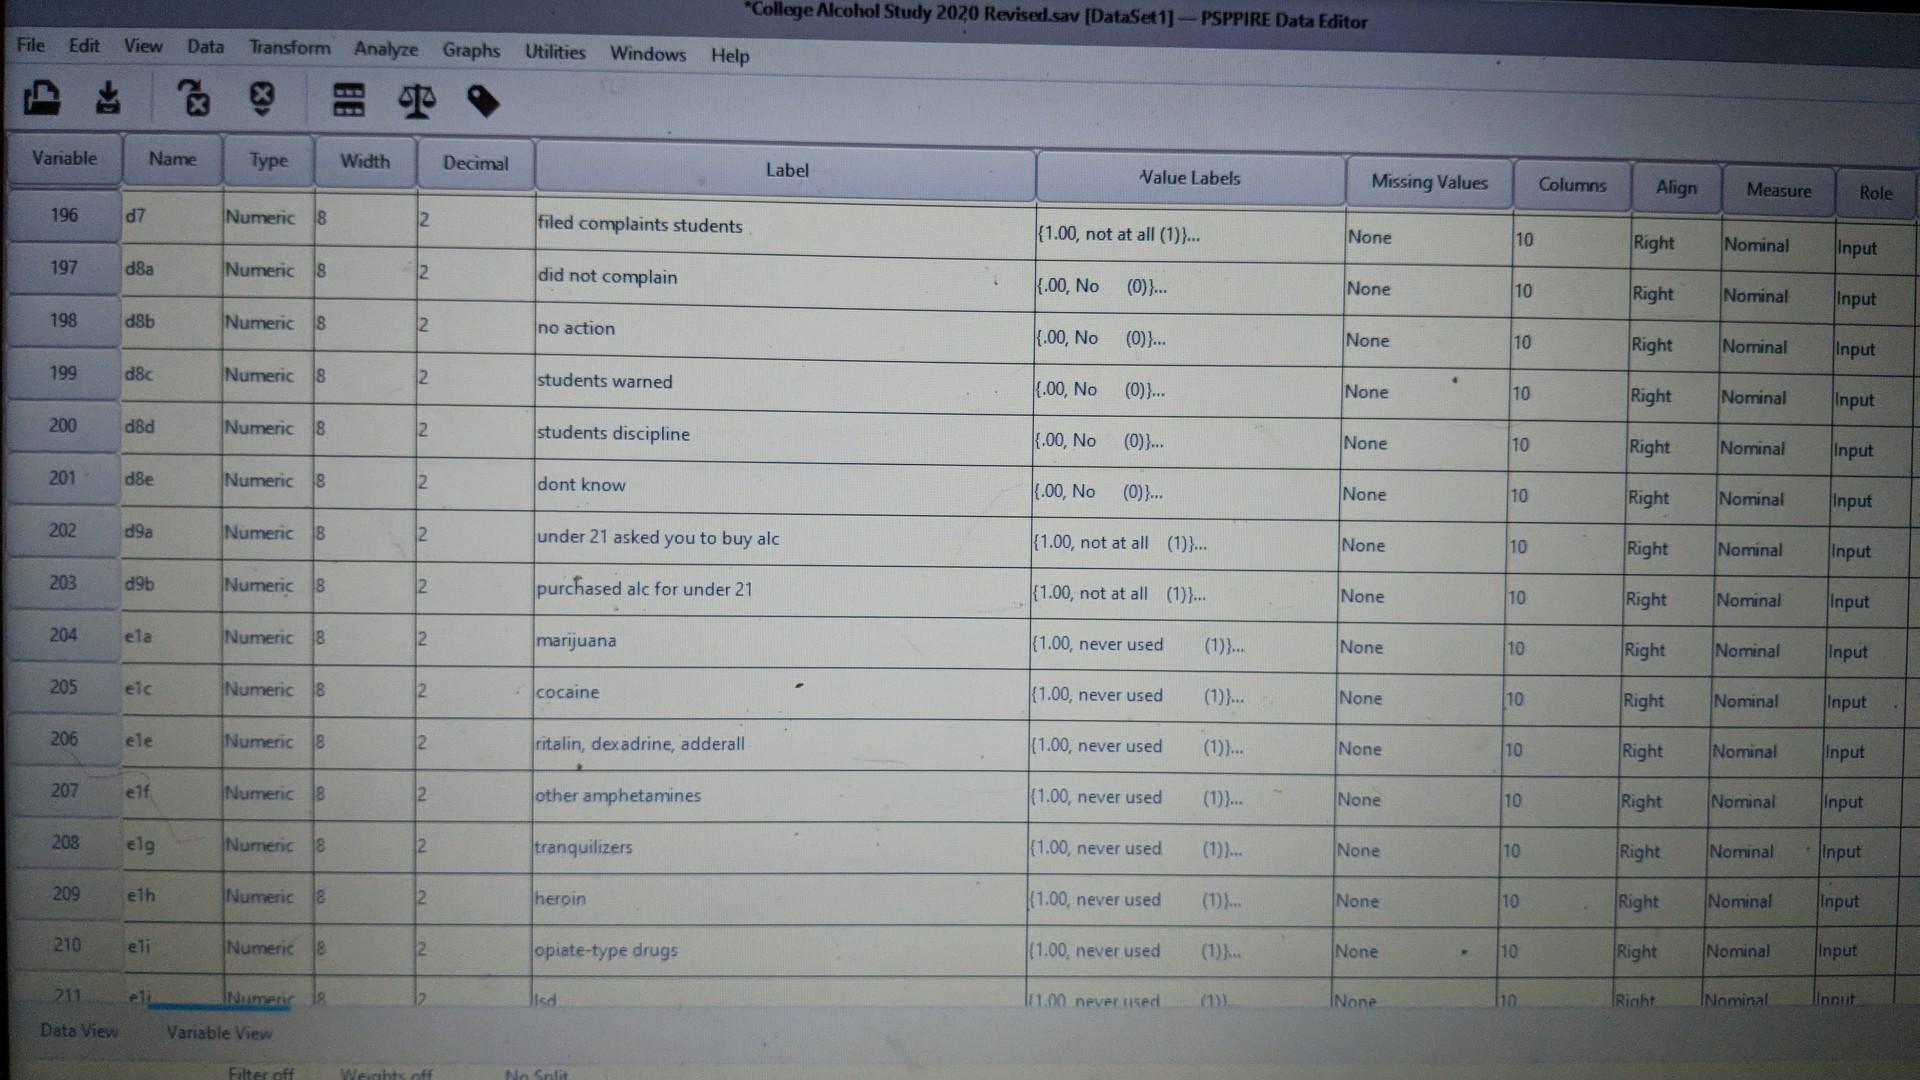
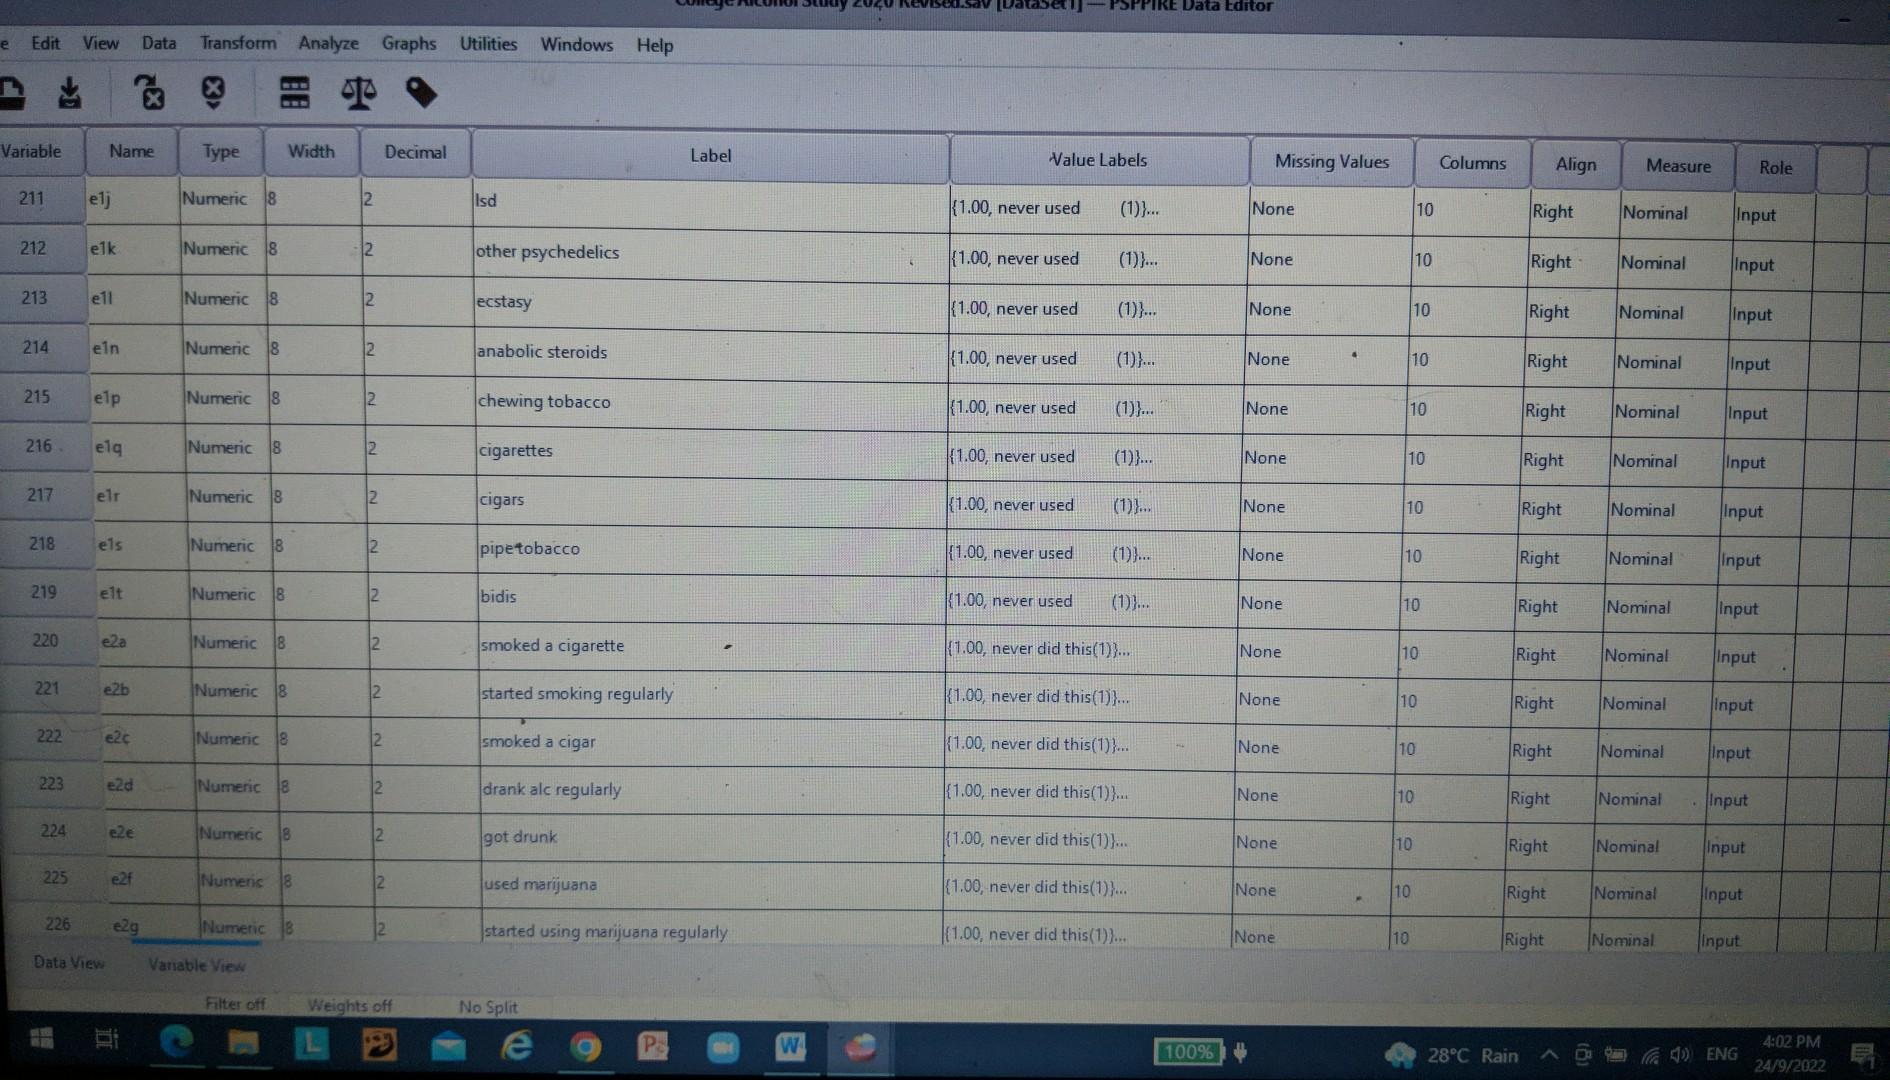
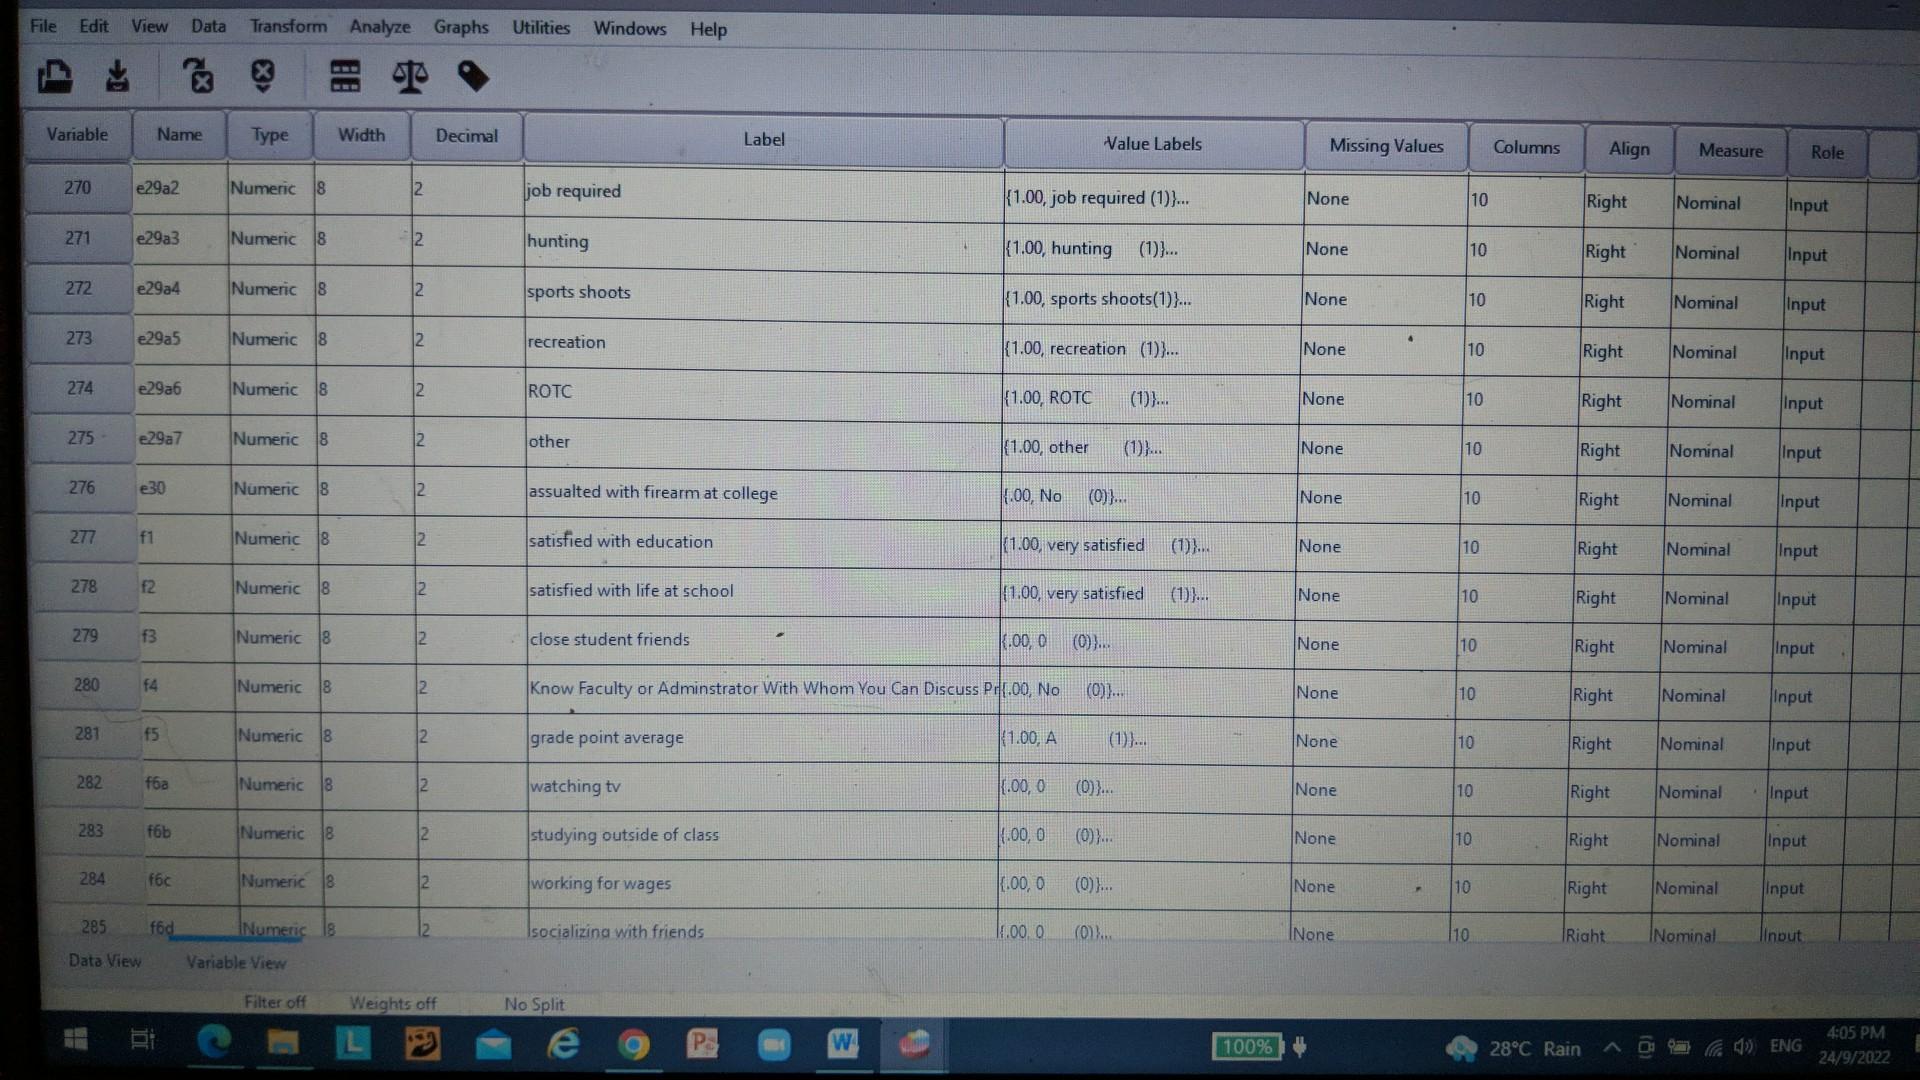
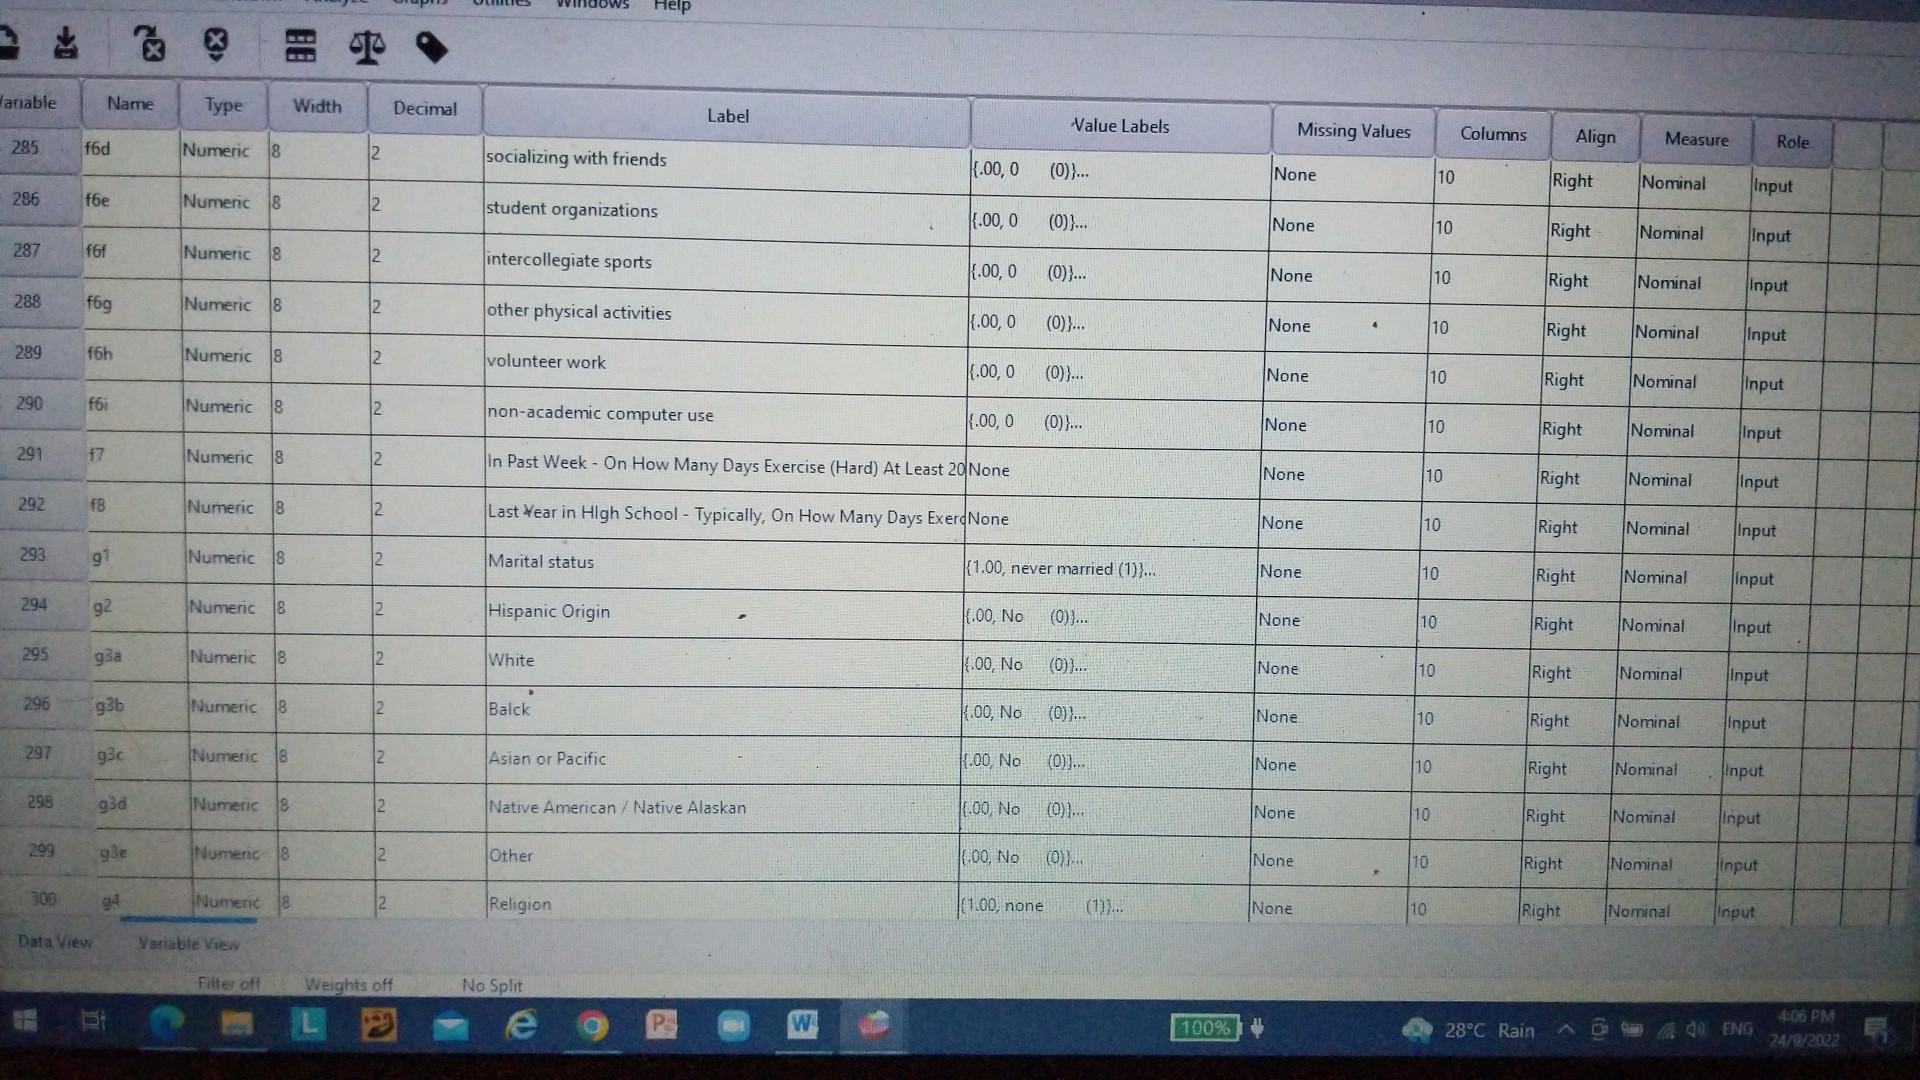
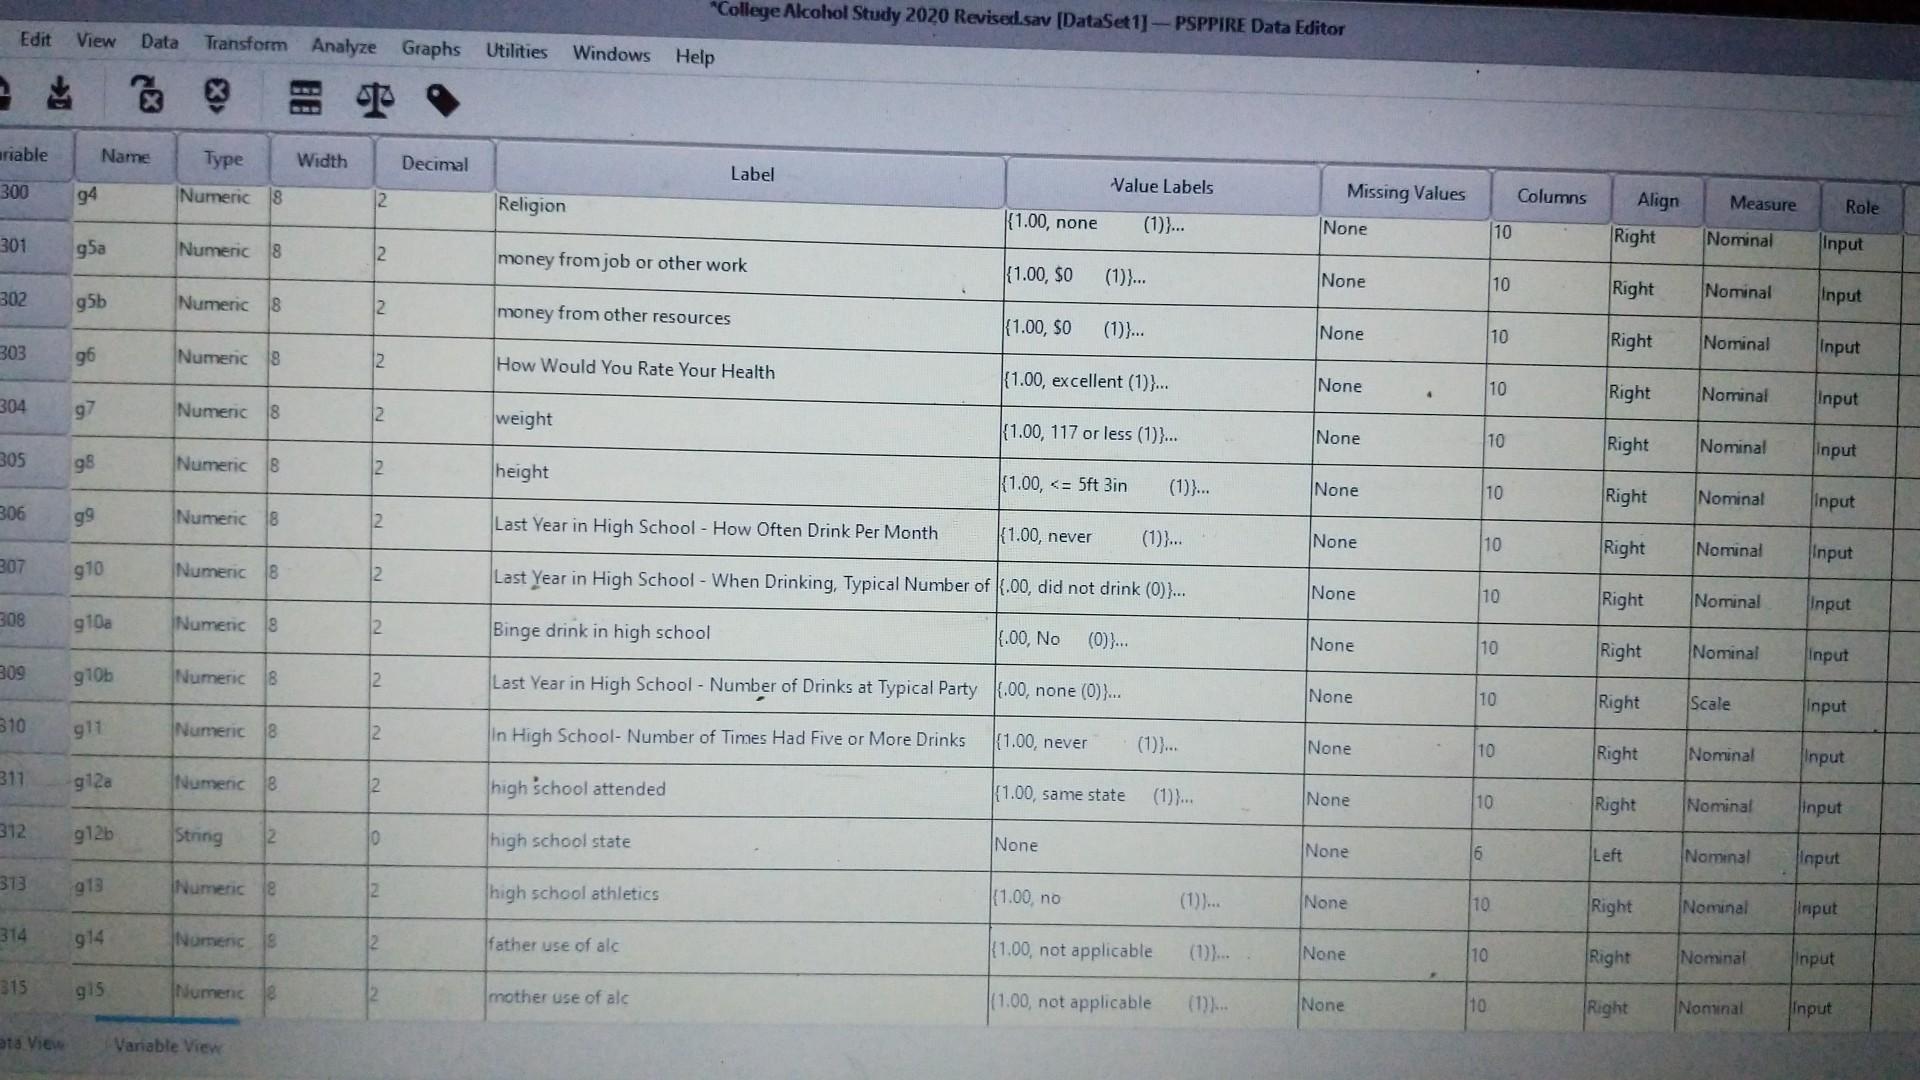
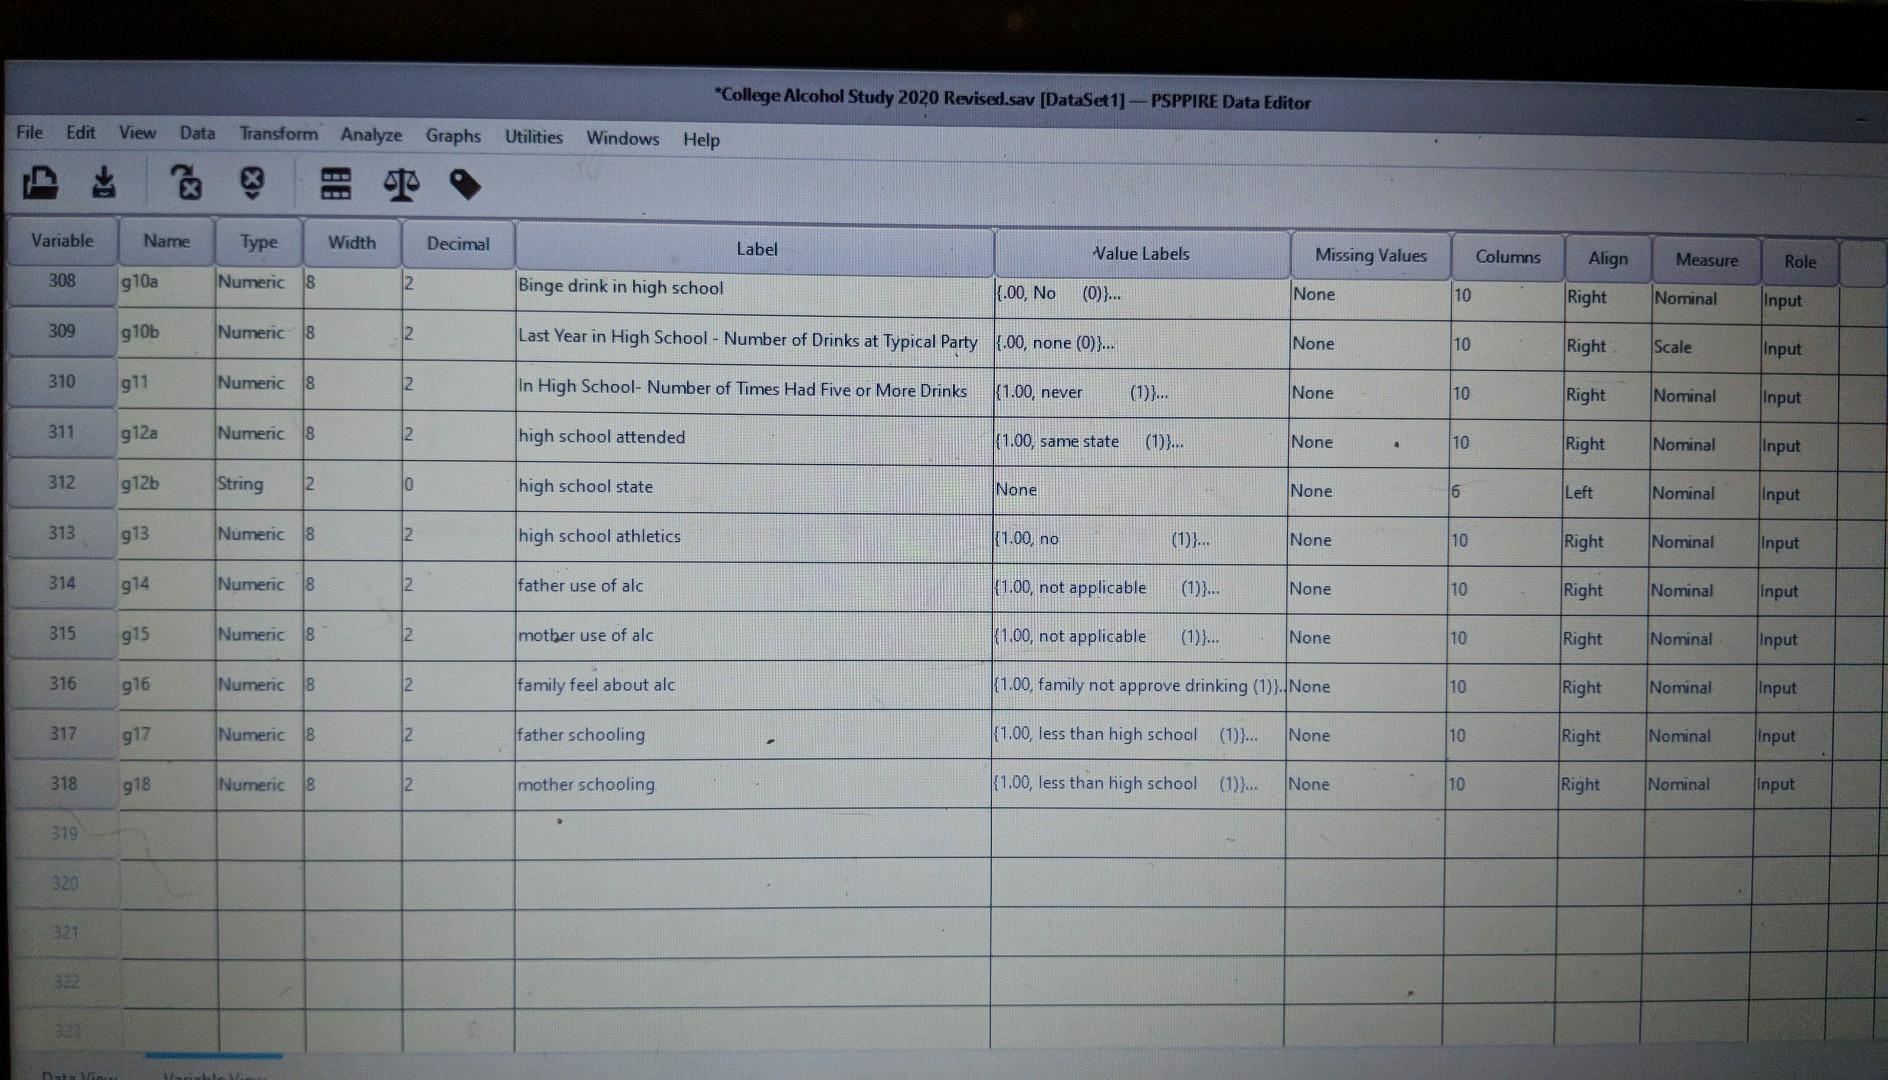
You will be using the following variables in this assignment. If you have not already done so, rename all the variables below: \( \begin{array}{ll}\text { age (a1) } & \text { binge_1 }(\mathrm{c} 1) \\ \text { gender (a2) } & \text { frat (a5) } \\ \text { schoolyyear (a3) } & \text { housing (a6) } \\ \text { living_arrangement (a6a) } & \text { transfer (a4) }\end{array} \) Rename the "living_arrangement variable." The new variable name should be: distance For the gender, age and school year variables, compute and report where applicable, the mean, median, mode, standard deviation, maximum and minimum for each variable. Only the appropriate statistics for each level of measurement should be computed. 1. Insert the statistics table for EACH variable into your response and interpret the statistics generated for each variable in full sentence form. If you report or interpret statistics that are inappropriate for the level of measurement, points will be deducted from your responses. 2. What percentage of respondents are women (gender)? Insert the frequency table for the gender variable. 3. What percentage of respondents are under 21 years old (age)? Insert the frequency table for the age variable 4. What percentage of respondents are either 20 years old or older (age)? 5. What percentage of respondents are either freshmen or sophomores (school year)? Insert the frequency table for the school year variable. M~Qu "College Alcohol Study 2020 Revised.sav [DataSet1] - PSPPIRE Data Editor File Edit View Data Transform Analyze Graphs Utilities Windows Help Edit View Data Transform Analyze Graphs Utilities Windows Help 10 dit View Data Transform Analyze Graphs Utilities Windows Help File Edit View Data Transform Analyze Graphs Utilities Windows Help "College Alcohol Study 2020 Revised.sav [DataSet1] - PSPPIRE Data Editor File Edit View Data Transform Analyze Graphs Utilities Windows Help e Edit View Data Transform Analyze Graphs Utilities Windows Help e Edit View Data Transform Analyze Graphs Utilities Windows Help Edit View Data Transform Analyze Graphs Utilities Windows Help File Edit View Data Transform Analyze Graphs Utilities Windows Help Edit View Data Transform Analyze Graphs Utilities Windows Help "College Alcohol Study 2020 Revised.sav [DataSet1] - PSPPIRE Data Editor File Edit View Data Transform Analyze Graphs Utilities Windows Help You will be using the following variables in this assignment. If you have not already done so, rename all the variables below: \( \begin{array}{ll}\text { age (a1) } & \text { binge_1 }(\mathrm{c} 1) \\ \text { gender (a2) } & \text { frat (a5) } \\ \text { schoolyyear (a3) } & \text { housing (a6) } \\ \text { living_arrangement (a6a) } & \text { transfer (a4) }\end{array} \) Rename the "living_arrangement variable." The new variable name should be: distance For the gender, age and school year variables, compute and report where applicable, the mean, median, mode, standard deviation, maximum and minimum for each variable. Only the appropriate statistics for each level of measurement should be computed. 1. Insert the statistics table for EACH variable into your response and interpret the statistics generated for each variable in full sentence form. If you report or interpret statistics that are inappropriate for the level of measurement, points will be deducted from your responses. 2. What percentage of respondents are women (gender)? Insert the frequency table for the gender variable. 3. What percentage of respondents are under 21 years old (age)? Insert the frequency table for the age variable 4. What percentage of respondents are either 20 years old or older (age)? 5. What percentage of respondents are either freshmen or sophomores (school year)? Insert the frequency table for the school year variable. M~Qu "College Alcohol Study 2020 Revised.sav [DataSet1] - PSPPIRE Data Editor File Edit View Data Transform Analyze Graphs Utilities Windows Help Edit View Data Transform Analyze Graphs Utilities Windows Help 10 dit View Data Transform Analyze Graphs Utilities Windows Help File Edit View Data Transform Analyze Graphs Utilities Windows Help "College Alcohol Study 2020 Revised.sav [DataSet1] - PSPPIRE Data Editor File Edit View Data Transform Analyze Graphs Utilities Windows Help e Edit View Data Transform Analyze Graphs Utilities Windows Help e Edit View Data Transform Analyze Graphs Utilities Windows Help Edit View Data Transform Analyze Graphs Utilities Windows Help File Edit View Data Transform Analyze Graphs Utilities Windows Help Edit View Data Transform Analyze Graphs Utilities Windows Help "College Alcohol Study 2020 Revised.sav [DataSet1] - PSPPIRE Data Editor File Edit View Data Transform Analyze Graphs Utilities Windows Help
Step by Step Solution
There are 3 Steps involved in it
1 Expert Approved Answer
Step: 1 Unlock

Question Has Been Solved by an Expert!
Get step-by-step solutions from verified subject matter experts
Step: 2 Unlock
Step: 3 Unlock