

Question: How was Walmart doing? How did it compare to its competitors? Page 10 9B19DO EXHIBIT 1: U.S. RETAIL CATEGORIES (PARTIAL LIST) (IN US$ BILLIONS) Category
How was Walmart doing? How did it compare to its competitors?
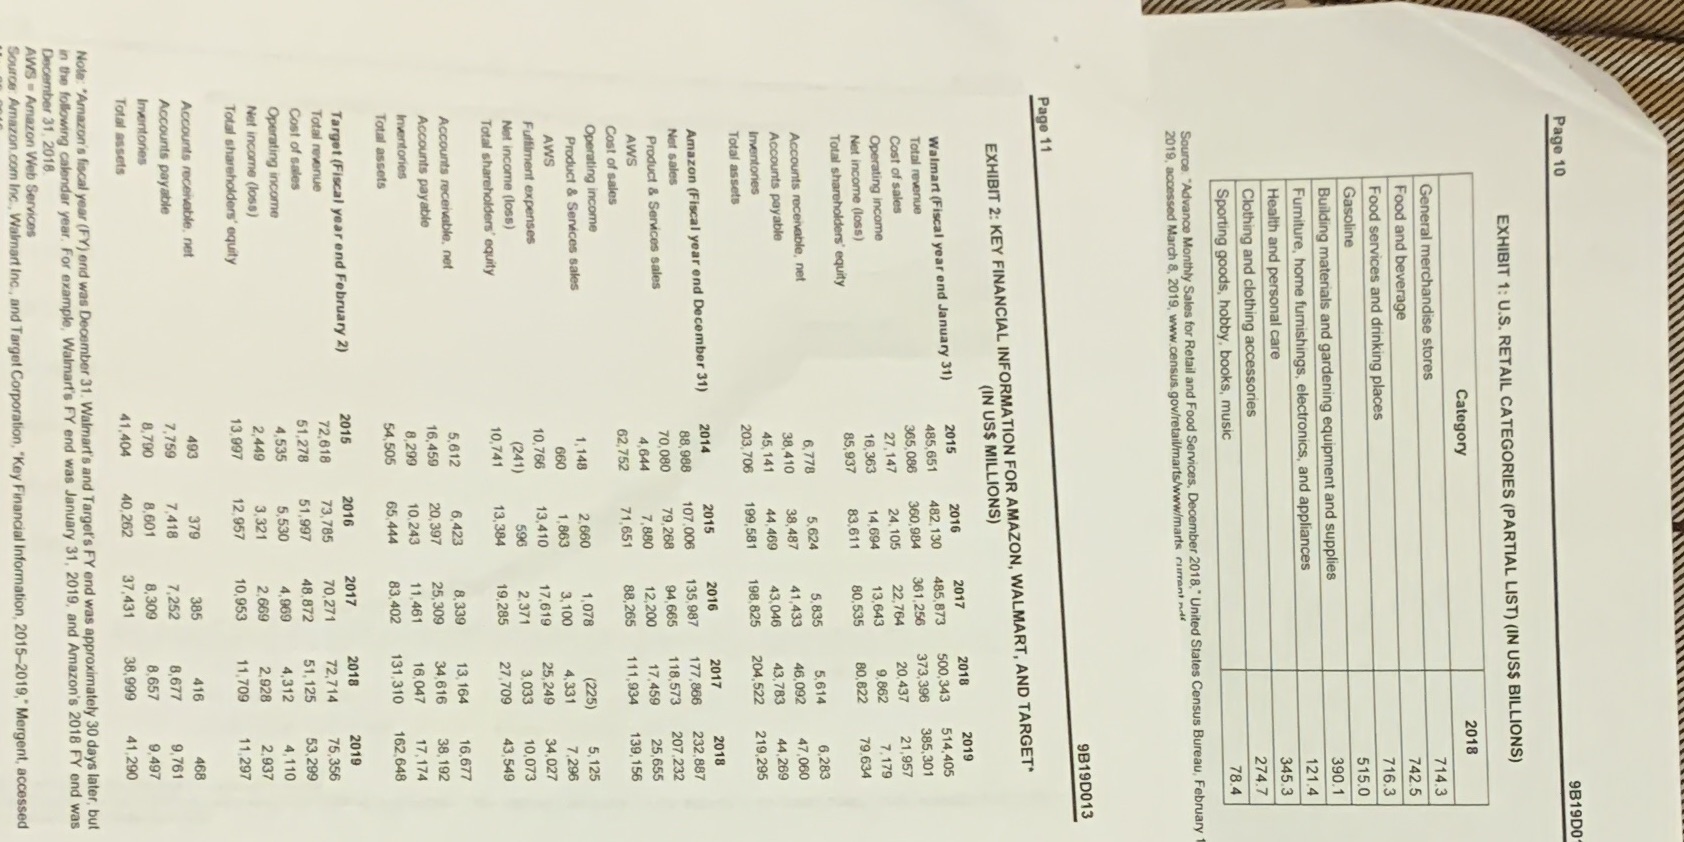
Page 10 9B19DO EXHIBIT 1: U.S. RETAIL CATEGORIES (PARTIAL LIST) (IN US$ BILLIONS) Category 2018 General merchandise stores 714.3 Food and beverage 742.5 Food services and drinking places 716.3 Gasoline 515.0 Building materials and gardening equipment and supplies 390.1 Furniture, home furnishings, electronics, and appliances 121.4 Health and personal care 345.3 Clothing and clothing accessories 274.7 Sporting goods, hobby, books, music 78.4 Source. "Advance Monthly Sales for Retail and Food Services, December 2018, " United States Census Bureau, February 2019, accessed March 8, 2019, www.census.gov/retail/marts/www/marts currant milf 9B19D013 Page 11 EXHIBIT 2: KEY FINANCIAL INFORMATION FOR AMAZON, WALMART, AND TARGET* (IN US$ MILLIONS) 2015 2016 2017 2018 2019 Walmart (Fiscal year end January 31) 485.651 482,130 485,873 500,343 514.405 Total revenue 385,301 Cost of sales 365,086 360,984 361,256 373,396 27,147 24. 105 22,764 20.437 21,957 Operating income 14.694 13,643 7.179 Net income (loss) 16.363 9.862 Total shareholders' equity 85,937 83.611 80.535 80. 822 79.634 Accounts receivable, net 6,778 5,624 5.835 5,614 6,283 38,487 41,433 46,092 47,060 Accounts payable 38.410 45. 141 43,046 43,783 Inventories 44. 469 44.269 204,522 219.295 Total assets 203, 706 199,581 198.825 2017 2018 Amazon (Fiscal year end December 31) 2014 2015 2016 Net sales 88,988 107.006 135,987 177,866 232,887 Product & Services sales 70,080 79.268 94, 665 118,573 207.232 17.459 25,655 AWS 4.644 7,880 12,200 Cost of sales 62,752 71,651 88,265 111,934 139, 156 Operating income Product & Services sales 1,148 2,660 1,078 (225) 5, 125 AWS 660 1,863 3, 100 4,331 7,296 Fulfilment expenses 10,766 13,410 17.619 25,249 34,027 Net income (loss) (241) 596 2,371 3,033 10,073 Total shareholders' equity 10,741 13,384 19,285 27,709 43,549 Accounts receivable, net 5,612 6,423 8.339 13. 164 16,677 Accounts payable 16,459 20,397 25,309 34.616 38, 192 Inventories 8.299 10.243 11.461 16.047 17,174 Total assets 54,505 65,414 83.402 131,310 162,648 Target (Fiscal year end February 2) 2015 2016 2017 2018 2019 Total revenue 72,618 73,785 70,271 72,714 75,356 Cost of sales 51,278 51,997 48.872 51,125 53,299 Operating income 4,535 5,530 4.969 4,312 4,110 Net income (loss) 2,449 3,321 2,669 2,928 2,937 Total shareholders' equity 13,997 12,957 10,953 11,709 11,297 Accounts receivable, net 493 379 385 416 468 Accounts payable 7,759 7.418 7,252 8,677 9,761 Inventories 8,790 8.601 8,309 8,657 9.497 Total assets 41.404 40.262 37,431 38,999 41,290 Note: "Amazon's fiscal year (FY) and was December 31. Walmart's and Target's FY end was approximately 30 days later, but in the following calendar year. For example, Walmart's FY end was January 31, 2019, and Amazon's 2018 FY end was December 31, 2018 AWS = Amazon Web Services Source: Amazon.com Inc., Walmart Inc, and Target Corporation, "Key Financial Information, 2015-2019," Mergent, accessed
Step by Step Solution
There are 3 Steps involved in it

Get step-by-step solutions from verified subject matter experts