

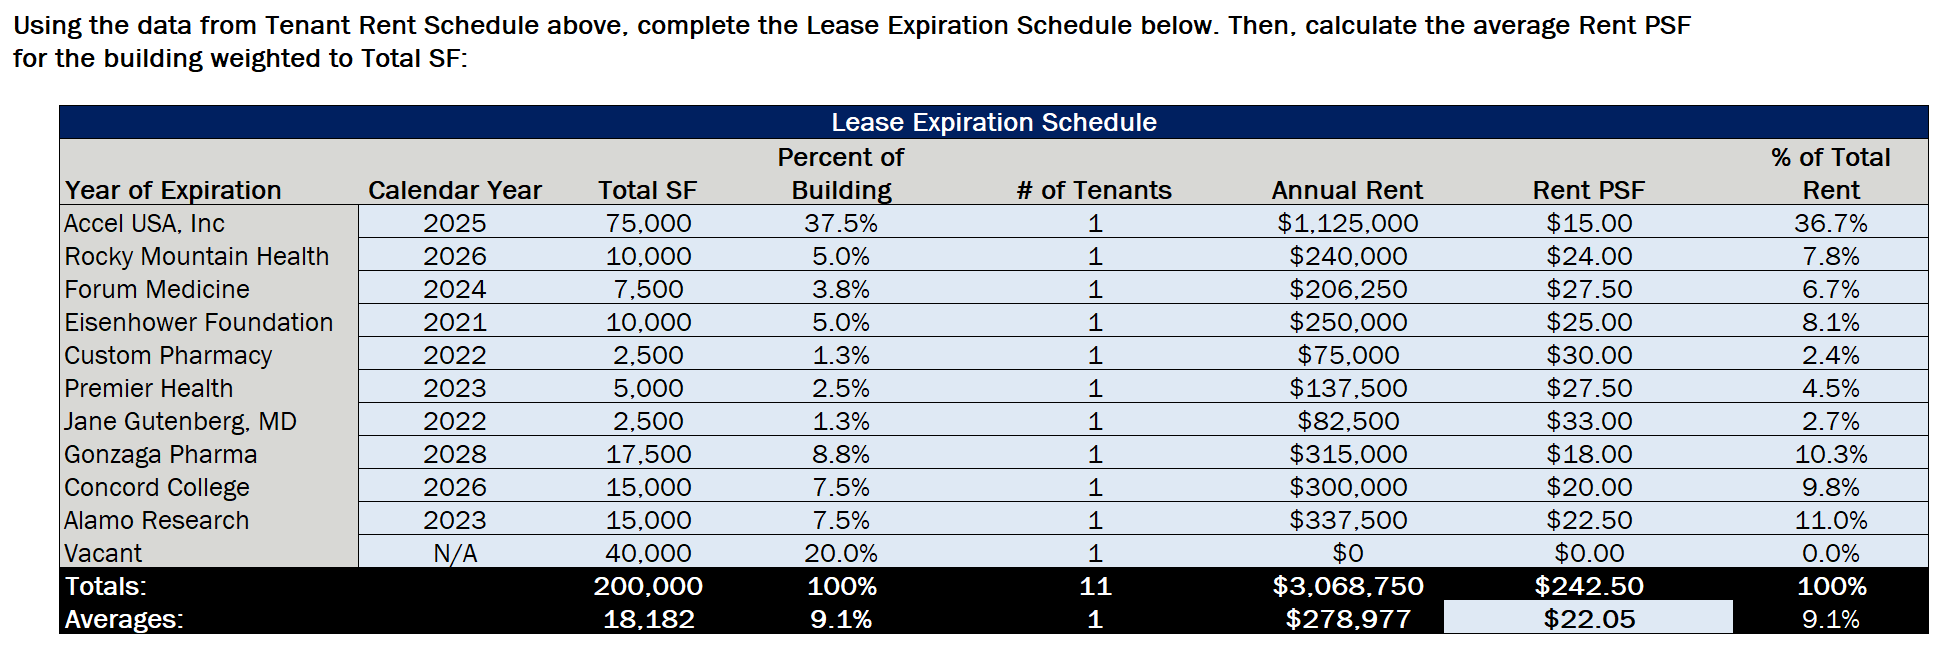
Question: How would I go about computing this lease expiration schedule? please show work and formulas for excel if possible Tenant Rent Schedule Tenants Total SF
How would I go about computing this lease expiration schedule? please show work and formulas for excel if possible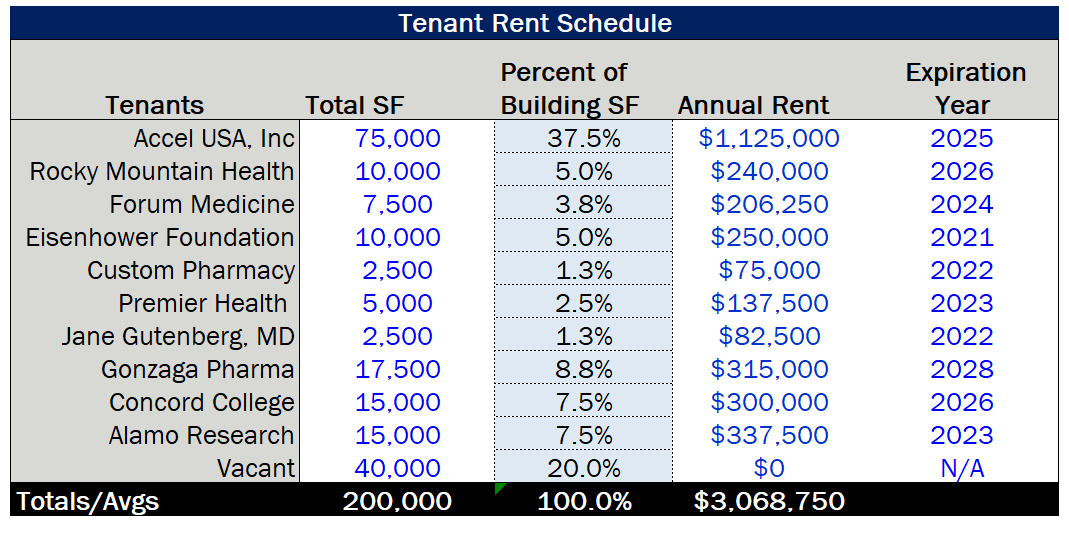
Step by Step Solution
There are 3 Steps involved in it
1 Expert Approved Answer
Step: 1 Unlock

Question Has Been Solved by an Expert!
Get step-by-step solutions from verified subject matter experts
Step: 2 Unlock
Step: 3 Unlock