

Question: How would I go about solving this? I am trying to take notes and work on homework and I am unsure how to go about
How would I go about solving this? I am trying to take notes and work on homework and I am unsure how to go about it.
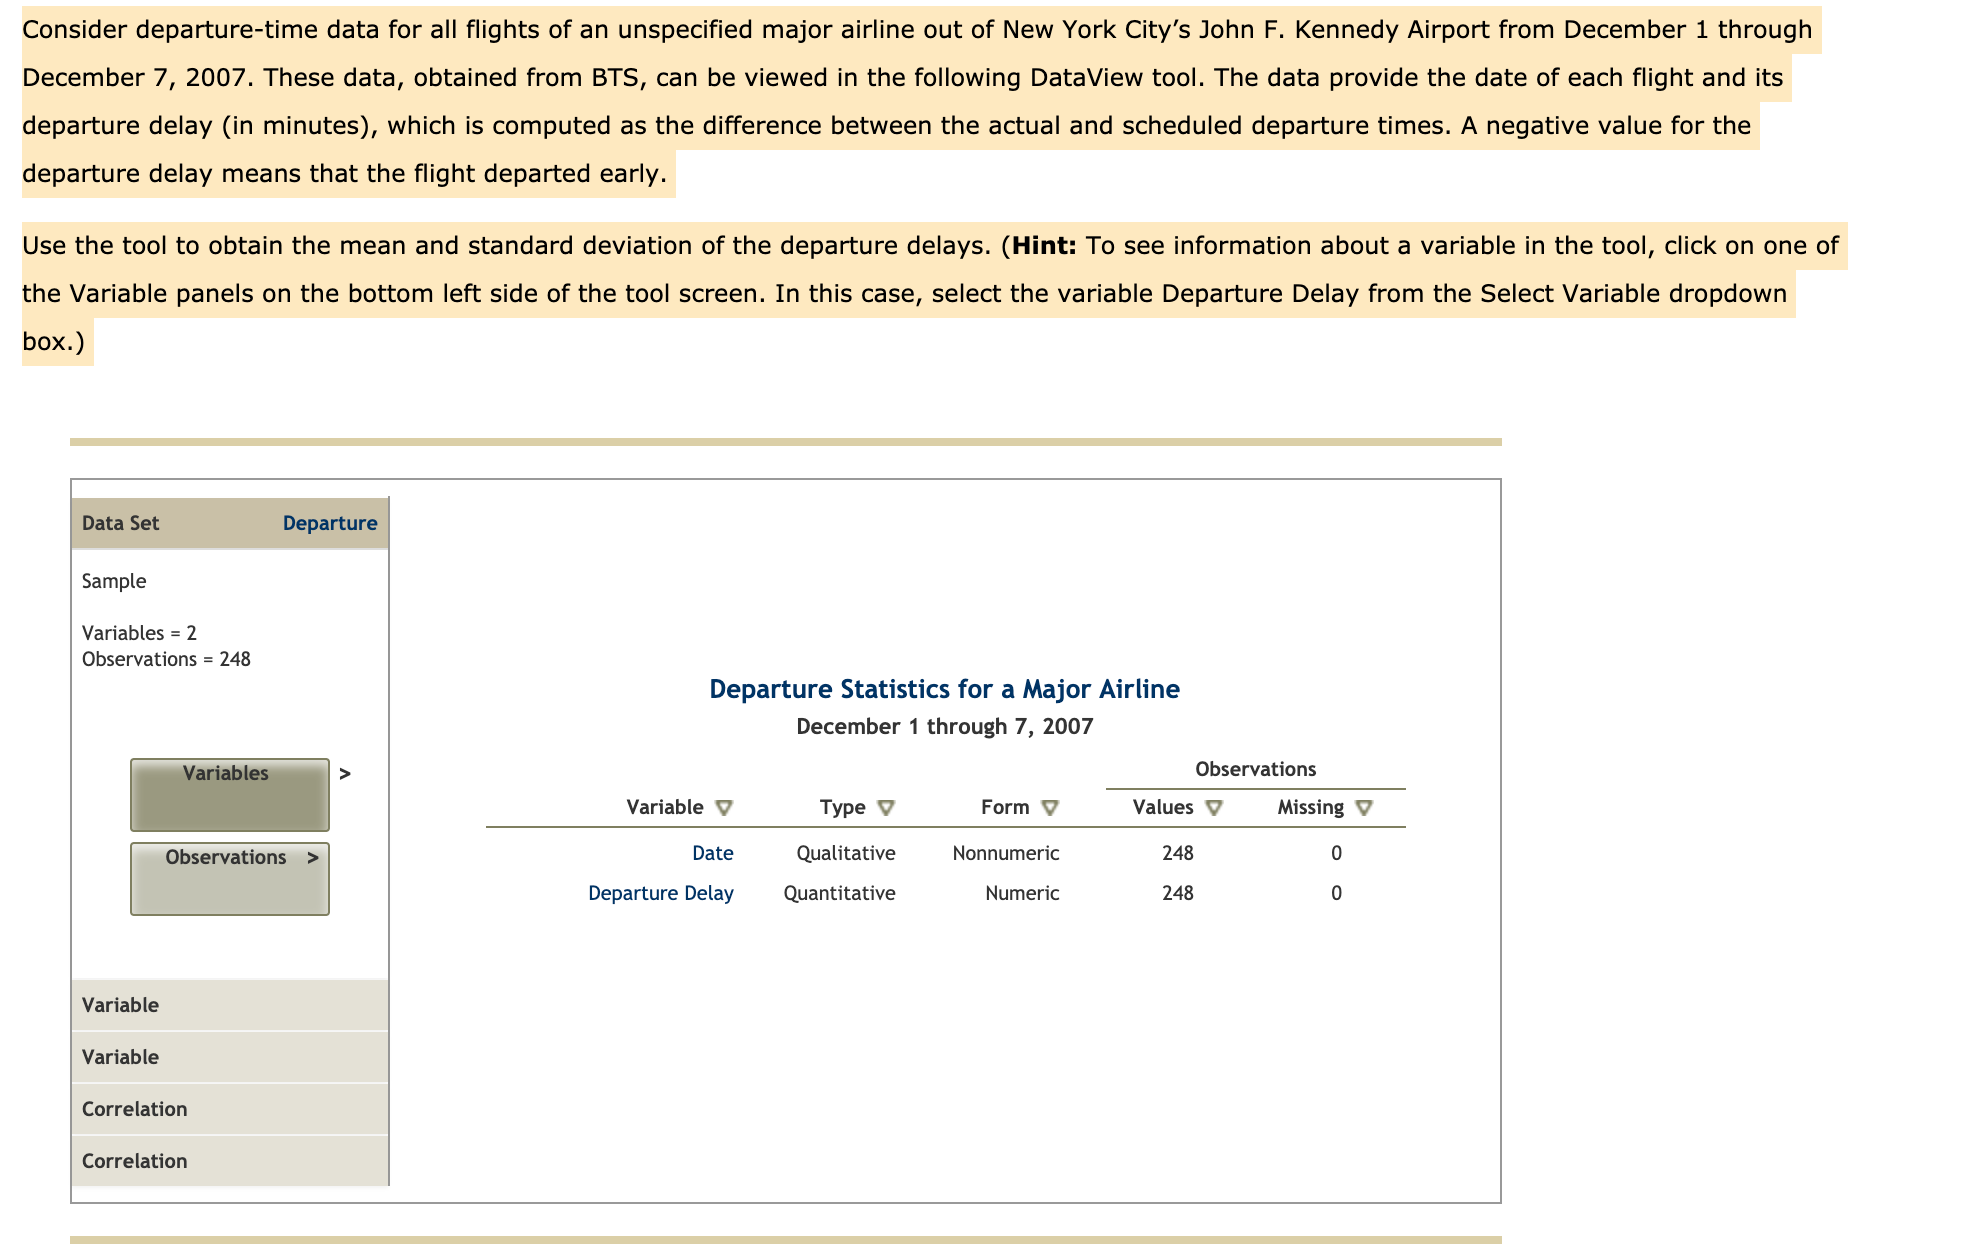
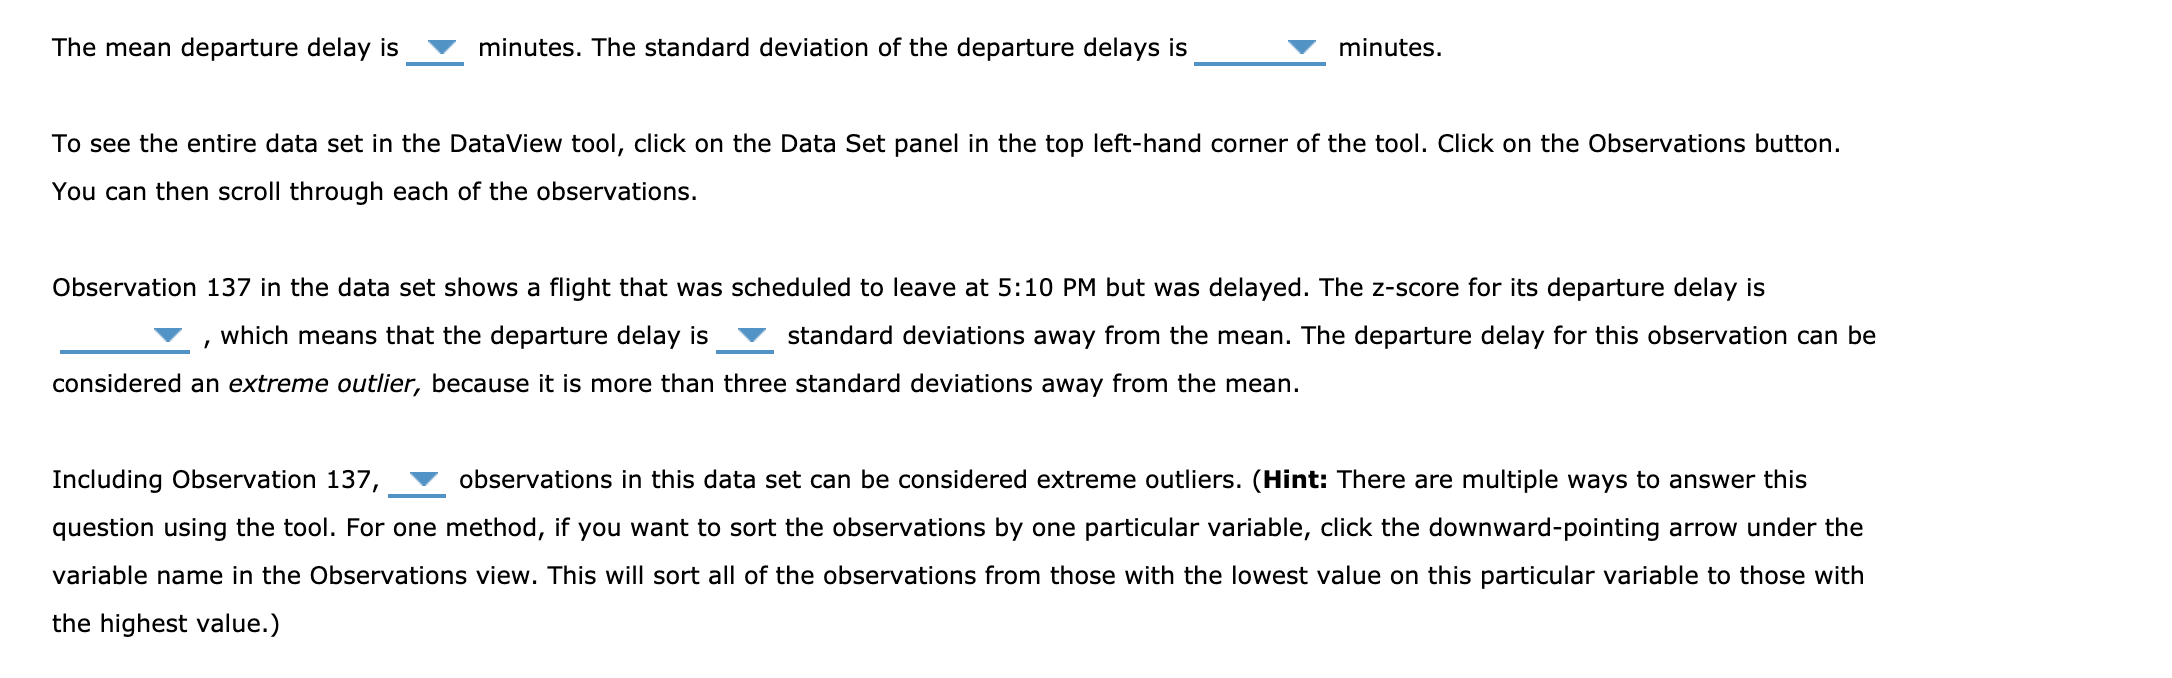
Consider departure-time data for all ights of an unspecified major airline out of New York City's John F. Kennedy Airport from December 1 through December 7, 2007. These data, obtained from BTS, can be viewed in the following DataView tool. The data provide the date of each ight and its departure delay (in minutes), which is computed as the difference between the actual and scheduled departure times. A negative value for the departure delay means that the ight departed early. Use the tool to obtain the mean and standard deviation of the departure delays. (Hint: To see information about a variable in the tool, click on one of the Variable panels on the bottom left side of the tool screen. In this case, select the variable Departure Delay from the Select Variable dropdown box.) Sample Variables = 2 Observations = 248 Departure Statistics for a Major Airline December 1 through 7, 2007 " > Observations - Variable V Type V Form V W F Date Qualitative Nunnumeric 248 0 - Departure Delay Quantitative Numeric 248 0 Variable Variable Correlation Correlation The mean departure delay is v minutes. The standard deviation of the departure delays is v minutes. To see the entire data set in the DataView tool, click on the Data Set panel in the top left-hand corner of the tool. Click on the Observations button. You can then scroll through each of the observations. Observation 137 in the data set shows a flight that was scheduled to leave at 5:10 PM but was delayed. The z-score for its departure delay is v , which means that the departure delay is v standard deviations away from the mean. The departure delay for this observation can be considered an extreme outlier, because it is more than three standard deviations away from the mean. Including Observation 137, ; observations in this data set can be considered extreme outliers. (Hint: There are multiple ways to answer this question using the tool. For one method, if you want to sort the observations by one particular variable, click the downward-pointing arrow under the variable name in the Observations view. This will sort all of the observations from those with the lowest value on this particular variable to those with the highest value.)
Step by Step Solution
There are 3 Steps involved in it

Get step-by-step solutions from verified subject matter experts