

Question: how would i interpret these histograms? fdensity 20 40 Week first symptomsdensity 50 100 150 200 Time symptoms_admitted
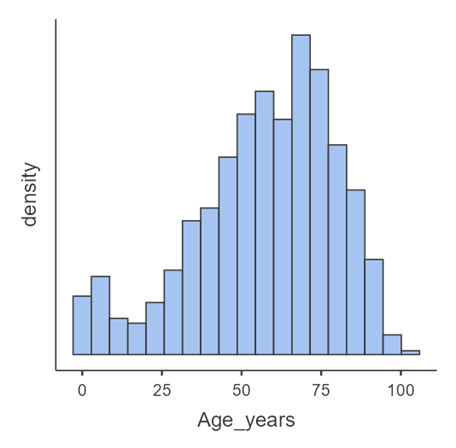
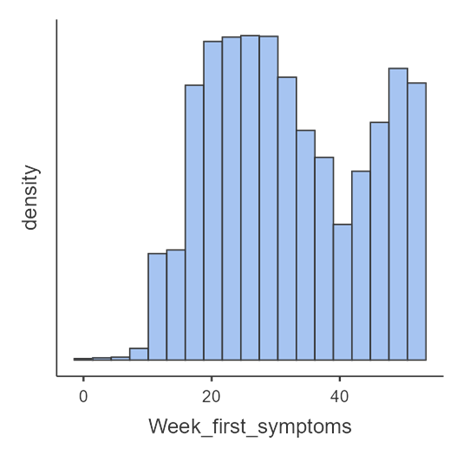
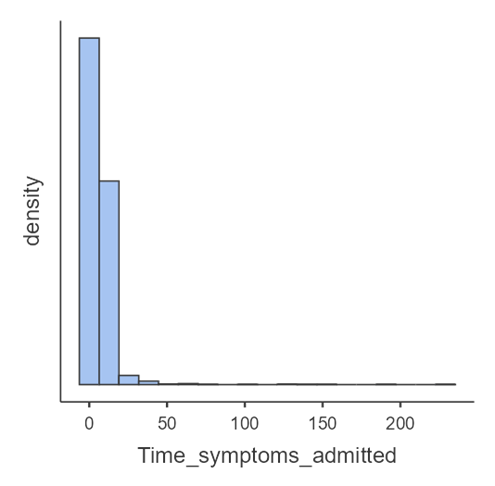
how would i interpret these histograms?
\fdensity 20 40 Week first symptomsdensity 50 100 150 200 Time symptoms_admitted
Step by Step Solution
There are 3 Steps involved in it
1 Expert Approved Answer
Step: 1 Unlock

Question Has Been Solved by an Expert!
Get step-by-step solutions from verified subject matter experts
Step: 2 Unlock
Step: 3 Unlock