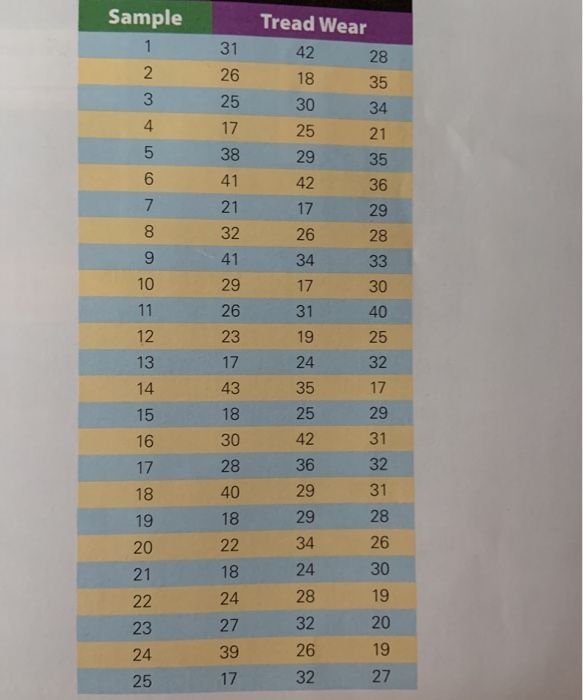
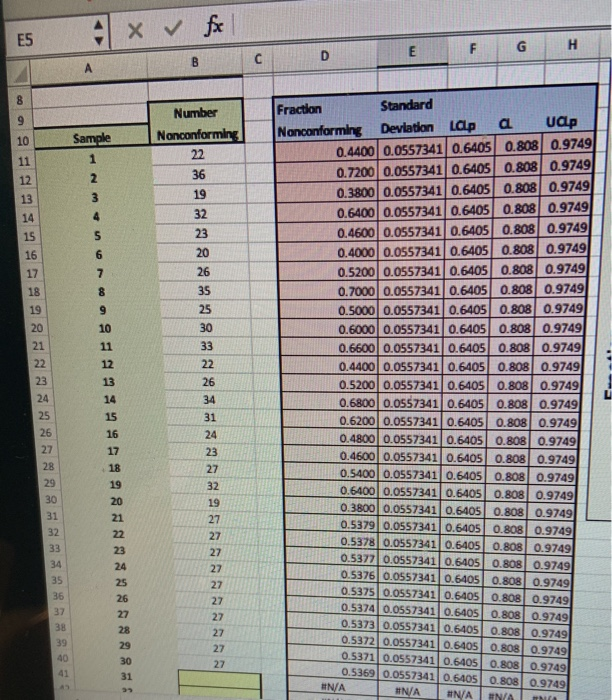
Question: how would i put this in excel 4.* Thirty samples of size 3, available in the C16P4 worksheet at OM Online, were taken from a

how would i put this in excel how would i put this in excel 4.* Thirty samples
how would i put this in excel 4.* Thirty samples
4.* Thirty samples of size 3, available in the C16P4 worksheet at OM Online, were taken from a machining process over a 15-hour period. Construct control charts using the Excel 3- and R-chart template. Verify the Excel calculations of the control limits by hand using the formulas in the chapter. Does the process appear to be in statistical control? Why or why not? Sample 1 2 3 4 5 6 7 8 9 10 11 12 13 14 15 16 17 18 19 20 E O OVOGAW 31 26 25 17 38 41 21 32 41 29 26 23 17 43 18 30 28 40 18 22 18 24 27 39 17 Tread Wear 42 28 18 35 . 30 34 25 21 29 35 42 36 17 29 26 28 34 33 17 30 31 40 19 25 24 32 35 17 25 29 42 31 36 32 29 31 29 28 26 24 30 28 19 32 20 26 19 32 27 PERDE 34 22 23 24 25 E x & fe A B C D E F G H Number Nonconforming Standard Deviation Lapa Sample BBURNENBNXEBOUWBENOWN Fraction Up Nonconforming 0.4400 0.0557341 0.6405 0.808 0.9749 0.7200 0.0557341 0.6405 0.808 0.9749 0.3800 0.0557341 0.6405 0.808 0.9749 0.6400 0.0557341 0.6405 0.808 0.9749 0.4600 0.0557341 0.6405 0.808 0.9749 0.4000 0.0557341 0.6405 0.808 0.9749 0.52000.0557341 0.6405 0.808 0.9749 0.7000 0.0557341 0.6405 0.808 0.9749 0.5000 0.0557341 0.6405 0.808 0.9749 0.6000 0.0557341 0.6405 0.808) 0.9749 0.6600 0.0557341 0.6405 0.808 0.9749 0.4400 0.0557341 0.6405 0.808 0.9749 0.5200 0.0557341 0.6405 0.808 0.9749 0.6800 0.0557341 0.6405 0.808 0.9749 0.62000.0557341 0.6405 0.808 0.9749 0.4800 0.0557341 0.6405 0.808 0.9749 0.4600 0.0557341 0.6405 0.808 0.9749 0.5400 0.0557341 0.6405 0.808 0.9749 0.6400 0.0557341 0.6405 0.808 0.9749 0.3800 0.0557341 0.6405 0.808 0.9749 0.5379 0.0557341 0.6405 0.808 0.9749 0.5378 0.0557341 0.6405 0.808 0.9749 0.5377 0.0557341 0.6405 0.808 0.9749 0.5376 0.0557341 0.6405 0.808 0.9749 0.5375 0.0557341 0.6405 0.808 0.9749 0.5374 0.0557341 0.6405 0.808 0.9749 0.5373 0.0557341 0.6405 0.808 0.9749 0.5372 0.0557341 0.5405 0.808 0.9749 0.5371 0.0557341 0.6405 0.808 0.9749 0.5369 0.0557341 0.6405 0.808 0.9749 IN/A WNA NO 4.* Thirty samples of size 3, available in the C16P4 worksheet at OM Online, were taken from a machining process over a 15-hour period. Construct control charts using the Excel 3- and R-chart template. Verify the Excel calculations of the control limits by hand using the formulas in the chapter. Does the process appear to be in statistical control? Why or why not? Sample 1 2 3 4 5 6 7 8 9 10 11 12 13 14 15 16 17 18 19 20 E O OVOGAW 31 26 25 17 38 41 21 32 41 29 26 23 17 43 18 30 28 40 18 22 18 24 27 39 17 Tread Wear 42 28 18 35 . 30 34 25 21 29 35 42 36 17 29 26 28 34 33 17 30 31 40 19 25 24 32 35 17 25 29 42 31 36 32 29 31 29 28 26 24 30 28 19 32 20 26 19 32 27 PERDE 34 22 23 24 25 E x & fe A B C D E F G H Number Nonconforming Standard Deviation Lapa Sample BBURNENBNXEBOUWBENOWN Fraction Up Nonconforming 0.4400 0.0557341 0.6405 0.808 0.9749 0.7200 0.0557341 0.6405 0.808 0.9749 0.3800 0.0557341 0.6405 0.808 0.9749 0.6400 0.0557341 0.6405 0.808 0.9749 0.4600 0.0557341 0.6405 0.808 0.9749 0.4000 0.0557341 0.6405 0.808 0.9749 0.52000.0557341 0.6405 0.808 0.9749 0.7000 0.0557341 0.6405 0.808 0.9749 0.5000 0.0557341 0.6405 0.808 0.9749 0.6000 0.0557341 0.6405 0.808) 0.9749 0.6600 0.0557341 0.6405 0.808 0.9749 0.4400 0.0557341 0.6405 0.808 0.9749 0.5200 0.0557341 0.6405 0.808 0.9749 0.6800 0.0557341 0.6405 0.808 0.9749 0.62000.0557341 0.6405 0.808 0.9749 0.4800 0.0557341 0.6405 0.808 0.9749 0.4600 0.0557341 0.6405 0.808 0.9749 0.5400 0.0557341 0.6405 0.808 0.9749 0.6400 0.0557341 0.6405 0.808 0.9749 0.3800 0.0557341 0.6405 0.808 0.9749 0.5379 0.0557341 0.6405 0.808 0.9749 0.5378 0.0557341 0.6405 0.808 0.9749 0.5377 0.0557341 0.6405 0.808 0.9749 0.5376 0.0557341 0.6405 0.808 0.9749 0.5375 0.0557341 0.6405 0.808 0.9749 0.5374 0.0557341 0.6405 0.808 0.9749 0.5373 0.0557341 0.6405 0.808 0.9749 0.5372 0.0557341 0.5405 0.808 0.9749 0.5371 0.0557341 0.6405 0.808 0.9749 0.5369 0.0557341 0.6405 0.808 0.9749 IN/A WNA NO

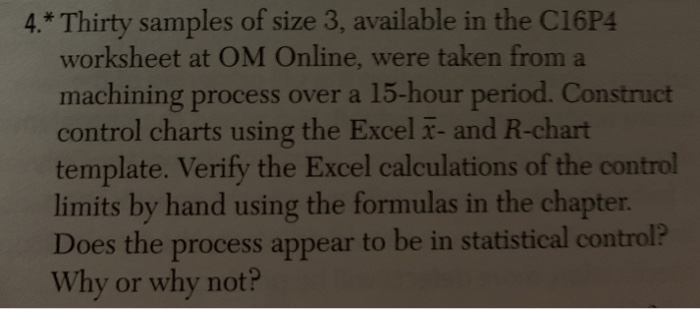
Step by Step Solution

There are 3 Steps involved in it

1 Expert Approved Answer
Step: 1 Unlock blur-text-image
Question Has Been Solved by an Expert!

Get step-by-step solutions from verified subject matter experts

Step: 2 Unlock
Step: 3 Unlock

Students Have Also Explored These Related General Management Questions!