

Question: How would I solve for this inside the cells? What would be the Excel formula? HELP! The above Cost of Plant Construction demonstrates significant 'economies
How would I solve for this inside the cells? What would be the Excel formula? HELP!
| The above Cost of Plant Construction demonstrates significant 'economies of scale'. | ||||||||||
| Economies of scale, enjoying a lower unit cost for a larger scale operation or investment, is common. | ||||||||||
| Notice how the Capex/Unit declines from $350 to $250 as the number of units of capacity added increases. | ||||||||||
| Furthermore the Unit Operating Cost declines from $50 to $40 as the number of units of capacity added increases. | ||||||||||
| Software development affords the ultimate level of economies of scale as once software is developed there is absolutely no additional cost for additional use. | ||||||||||
| This is true for all intellectual property including entertainment content and is almost valid for pharmaceutical and other medical technologies. | ||||||||||
| The model permits users to select the size of Capacity Expansion in Units | ||||||||||
| Capacity Expansion (Units) | 150 | |||||||||
| Write a formula using an IF (conditional) function in the green box below that selects the unit cost based on the Capacity Expansion above. | ||||||||||
| Unit Operating Cost | ||||||||||
| Hint: If you hard code the Unit Operating Cost of $45 related to Capacity Expansion of 150 Units downstream questions will be graded as incorrect. | ||||||||||
| Write formulas in row 102 such that in every year prior to a year in which adequate capacity would not otherwise exist capacity is expanded by the quantity selected in D91. | ||||||||||
| Note: Additional Capacity becomes available in the year after the investment is made. | ||||||||||
| Calculate the Incremental Unit Sales as the Company's Unit Sales minus the Capacity Constrained Unit Sales. | ||||||||||
| The existing plant has a Unit Operating Cost of $60. | |||||||||
| The plan is to fully load any new plant because of its lower operating cost and to utilize the existing plant to manufacture the balance. | |||||||||
| The price of Product A is $110 and the price of Product B is $100. | |||||||||
| The Incremental Gross Profit is the Incremental Unit Sales multiplied by the Unit Gross Profit | |||||||||
| The average Unit Cost will depend on the: | |||||||||
| Size of plant constructed | |||||||||
| Mix of manufacturing done at the lower cost new plant rather than the higher cost existing plant | |||||||||
| We will first measure Gross Margin based on the $60 Unit Cost of the existing plant. | |||||||||
| However, new capacity will operate at a lower unit cost and therefore the Operating Cost Reduction is the product of: | |||||||||
| $60 Unit Cost of the existing plant minus the Unit Cost of the new plant dependent on the size of new plant constructed. | |||||||||
| The Cumulative Additional Capacity because all of that capacity will be utilized before loading the higher cost existing plant. | |||||||||
| The Incremental Cash Flow is the sum of the Incremental Gross Profit plus the Operating Cost Reduction minus the Capital Expenditures | |||||||||
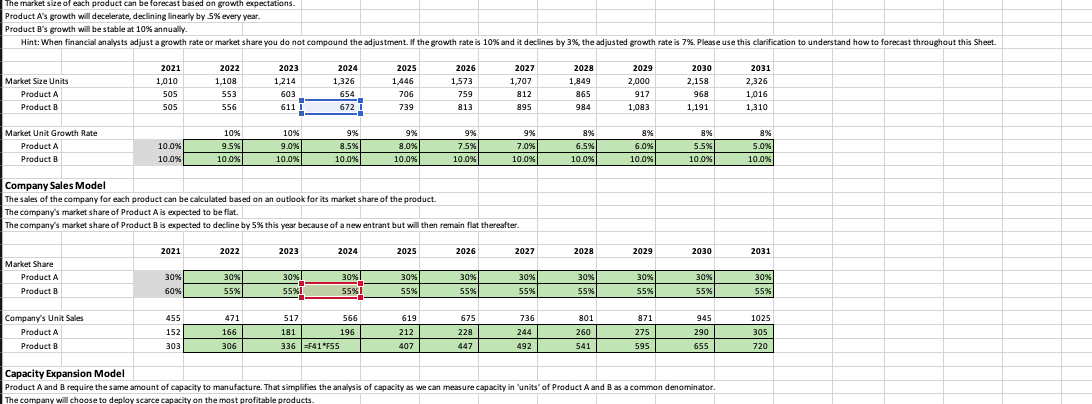
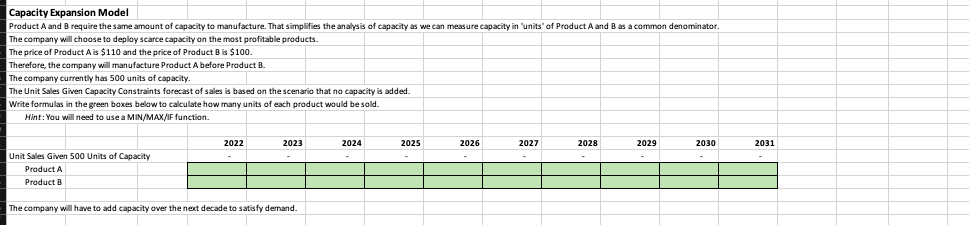
The market size of each product can be forecast based on growth expectations. Product A's growth will decelerate, declining linearly by 5% every year. Product B's growth will be stable at 10% annually. Hint: When financial analysts adjust a growth rate or market share you do not compound the adjustment. If the growth rate is 10% and it declines by 3%, the adjusted growth rate is 7%. Please use this clarification to understand how to forecast throughout this Sheet. Market Size Units Product A Product B 2021 1,010 505 SOS 2022 1,108 553 556 2023 1,214 603 611 2024 1,326 654 6721 2025 1.446 706 739 2026 1,573 759 813 2027 1,707 812 895 2028 1,849 865 2029 2,000 917 1,083 2030 2,158 968 1,191 2031 2.326 1,016 1,310 984 Market Unit Growth Rate Product A Product B 10% % 9.5% 10.0% 10.0% 10% 9.0% 10.0% 9% 8.5% 10.0% 9% 8.0% 10.0% 9% 7.5% 10.0% 99% 7.0% 10.0% 8% 6.5% 10.0% 8% 6.0% 10.0% 89 5.5% 10.0% 8% 5.0% 10.0% 10.0% Company Sales Model The sales of the company for each product can be calculated based on an outlook for its market share of the product. The company's market share of Product A is expected to be flat. The company's market share of Product B is expected to decline by 5% this year because of a new entrant but will then remain flat thereafter. 2021 2022 2023 2024 2025 2026 2027 2028 2029 2030 2031 Market Share Product A Product B 30% 30% 309 30% 30% 30% 30% 30% 30% 55% 30% 55%! 30% 55% % 60% 55% 55% 55% 55% 55% 55% 55% 471 619 736 1025 Company's Unit Sales Product A Product B 455 152 303 517 566 181 196 336 =F41 *555 675 228 166 212 407 801 260 541 244 492 871 275 595 305 945 290 655 306 447 720 Capacity Expansion Model Product A and B require the same amount of capacity to manufacture. That simplifies the analysis of capacity as we can measure capacity in 'units' of Product A and B as a common denominator. The company will choose to deploy scarce capacity on the most profitable products Capacity Expansion Model Product A and B require the same amount of capacity to manufacture. That simplifies the analysis of capacity as we can measure capacity in 'units' of Product A and B as a common denominator. The company will choose to deploy scarce capacity on the most profitable products. The price of Product A is $110 and the price of Product B is $100. Therefore, the company will manufacture Product A before Product B. The company currently has 500 units of capacity. The Unit Sales Given Capacity Constraints forecast of sales is based on the scenario that no capacity is added. Write formulas in the green boxes below to calculate how many units of each product would be sold. Hint: You will need to use a MIN/MAX/IF function. 2022 2023 2024 2025 2026 2027 2028 2029 2030 2031 Unit Sales Given 500 units of Capacity Product Product B The company will have to add capacity over the next decade to satisfy demand. The market size of each product can be forecast based on growth expectations. Product A's growth will decelerate, declining linearly by 5% every year. Product B's growth will be stable at 10% annually. Hint: When financial analysts adjust a growth rate or market share you do not compound the adjustment. If the growth rate is 10% and it declines by 3%, the adjusted growth rate is 7%. Please use this clarification to understand how to forecast throughout this Sheet. Market Size Units Product A Product B 2021 1,010 505 SOS 2022 1,108 553 556 2023 1,214 603 611 2024 1,326 654 6721 2025 1.446 706 739 2026 1,573 759 813 2027 1,707 812 895 2028 1,849 865 2029 2,000 917 1,083 2030 2,158 968 1,191 2031 2.326 1,016 1,310 984 Market Unit Growth Rate Product A Product B 10% % 9.5% 10.0% 10.0% 10% 9.0% 10.0% 9% 8.5% 10.0% 9% 8.0% 10.0% 9% 7.5% 10.0% 99% 7.0% 10.0% 8% 6.5% 10.0% 8% 6.0% 10.0% 89 5.5% 10.0% 8% 5.0% 10.0% 10.0% Company Sales Model The sales of the company for each product can be calculated based on an outlook for its market share of the product. The company's market share of Product A is expected to be flat. The company's market share of Product B is expected to decline by 5% this year because of a new entrant but will then remain flat thereafter. 2021 2022 2023 2024 2025 2026 2027 2028 2029 2030 2031 Market Share Product A Product B 30% 30% 309 30% 30% 30% 30% 30% 30% 55% 30% 55%! 30% 55% % 60% 55% 55% 55% 55% 55% 55% 55% 471 619 736 1025 Company's Unit Sales Product A Product B 455 152 303 517 566 181 196 336 =F41 *555 675 228 166 212 407 801 260 541 244 492 871 275 595 305 945 290 655 306 447 720 Capacity Expansion Model Product A and B require the same amount of capacity to manufacture. That simplifies the analysis of capacity as we can measure capacity in 'units' of Product A and B as a common denominator. The company will choose to deploy scarce capacity on the most profitable products Capacity Expansion Model Product A and B require the same amount of capacity to manufacture. That simplifies the analysis of capacity as we can measure capacity in 'units' of Product A and B as a common denominator. The company will choose to deploy scarce capacity on the most profitable products. The price of Product A is $110 and the price of Product B is $100. Therefore, the company will manufacture Product A before Product B. The company currently has 500 units of capacity. The Unit Sales Given Capacity Constraints forecast of sales is based on the scenario that no capacity is added. Write formulas in the green boxes below to calculate how many units of each product would be sold. Hint: You will need to use a MIN/MAX/IF function. 2022 2023 2024 2025 2026 2027 2028 2029 2030 2031 Unit Sales Given 500 units of Capacity Product Product B The company will have to add capacity over the next decade to satisfy demand
Step by Step Solution
There are 3 Steps involved in it

Get step-by-step solutions from verified subject matter experts