

Question: How would this graph look like using geogebra graphing calculator? Can you please show me what this would look like to Geogrbra and not hand
How would this graph look like using geogebra graphing calculator? Can you please show me what this would look like to Geogrbra and not hand drawn? I'm having a hard time trying to graph this in GeoGebra.

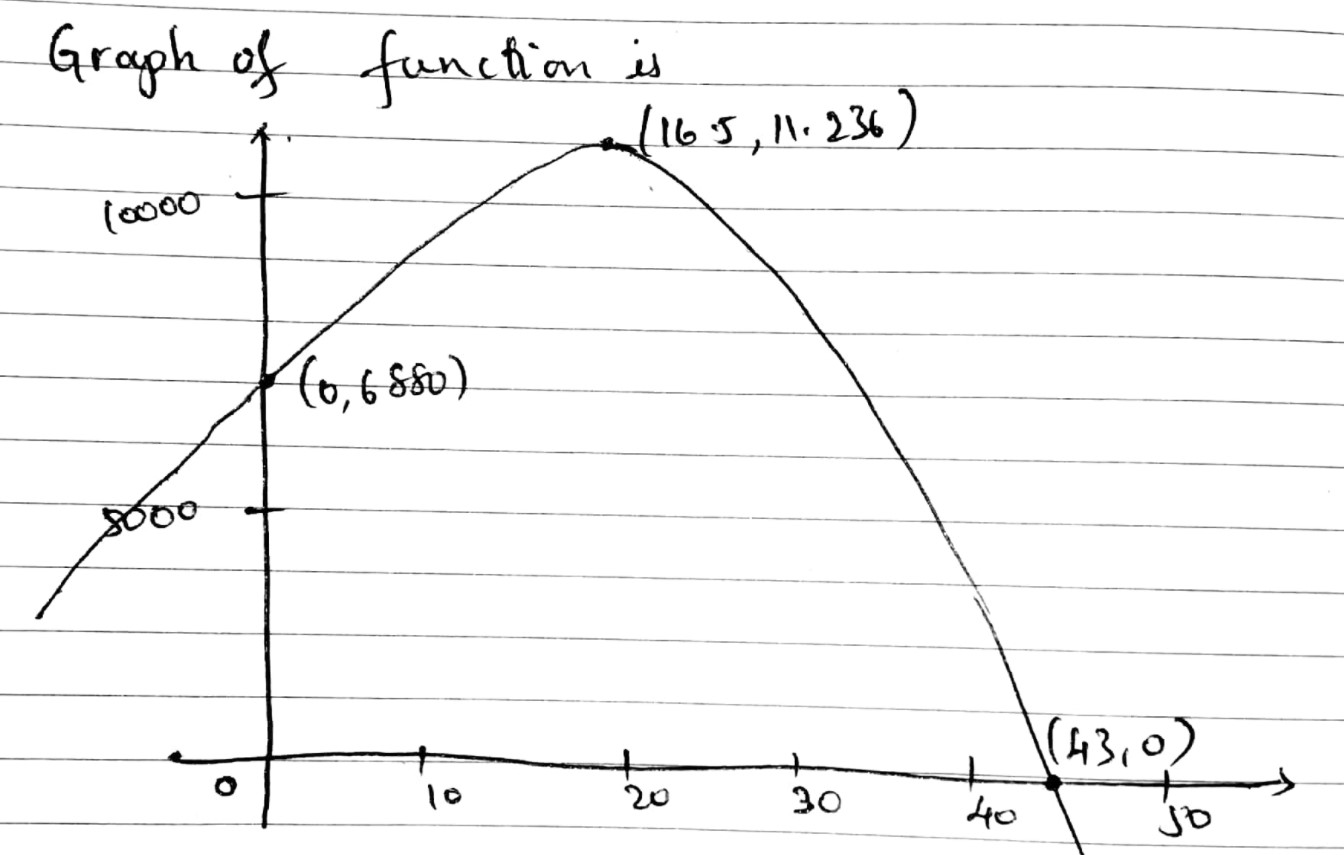
Graph of function is (165, 11. 236 10000 ( 0, 68 80 ) O 10 20 (43, 0) 30 40 JD
Step by Step Solution
There are 3 Steps involved in it
1 Expert Approved Answer
Step: 1 Unlock

Question Has Been Solved by an Expert!
Get step-by-step solutions from verified subject matter experts
Step: 2 Unlock
Step: 3 Unlock