

Question: I really need help for this assignment. You may have to use Desmos. ? Il. Inverse Square 21. Using a graphing calculator, graph f (x)
I really need help for this assignment. You may have to use Desmos. ?
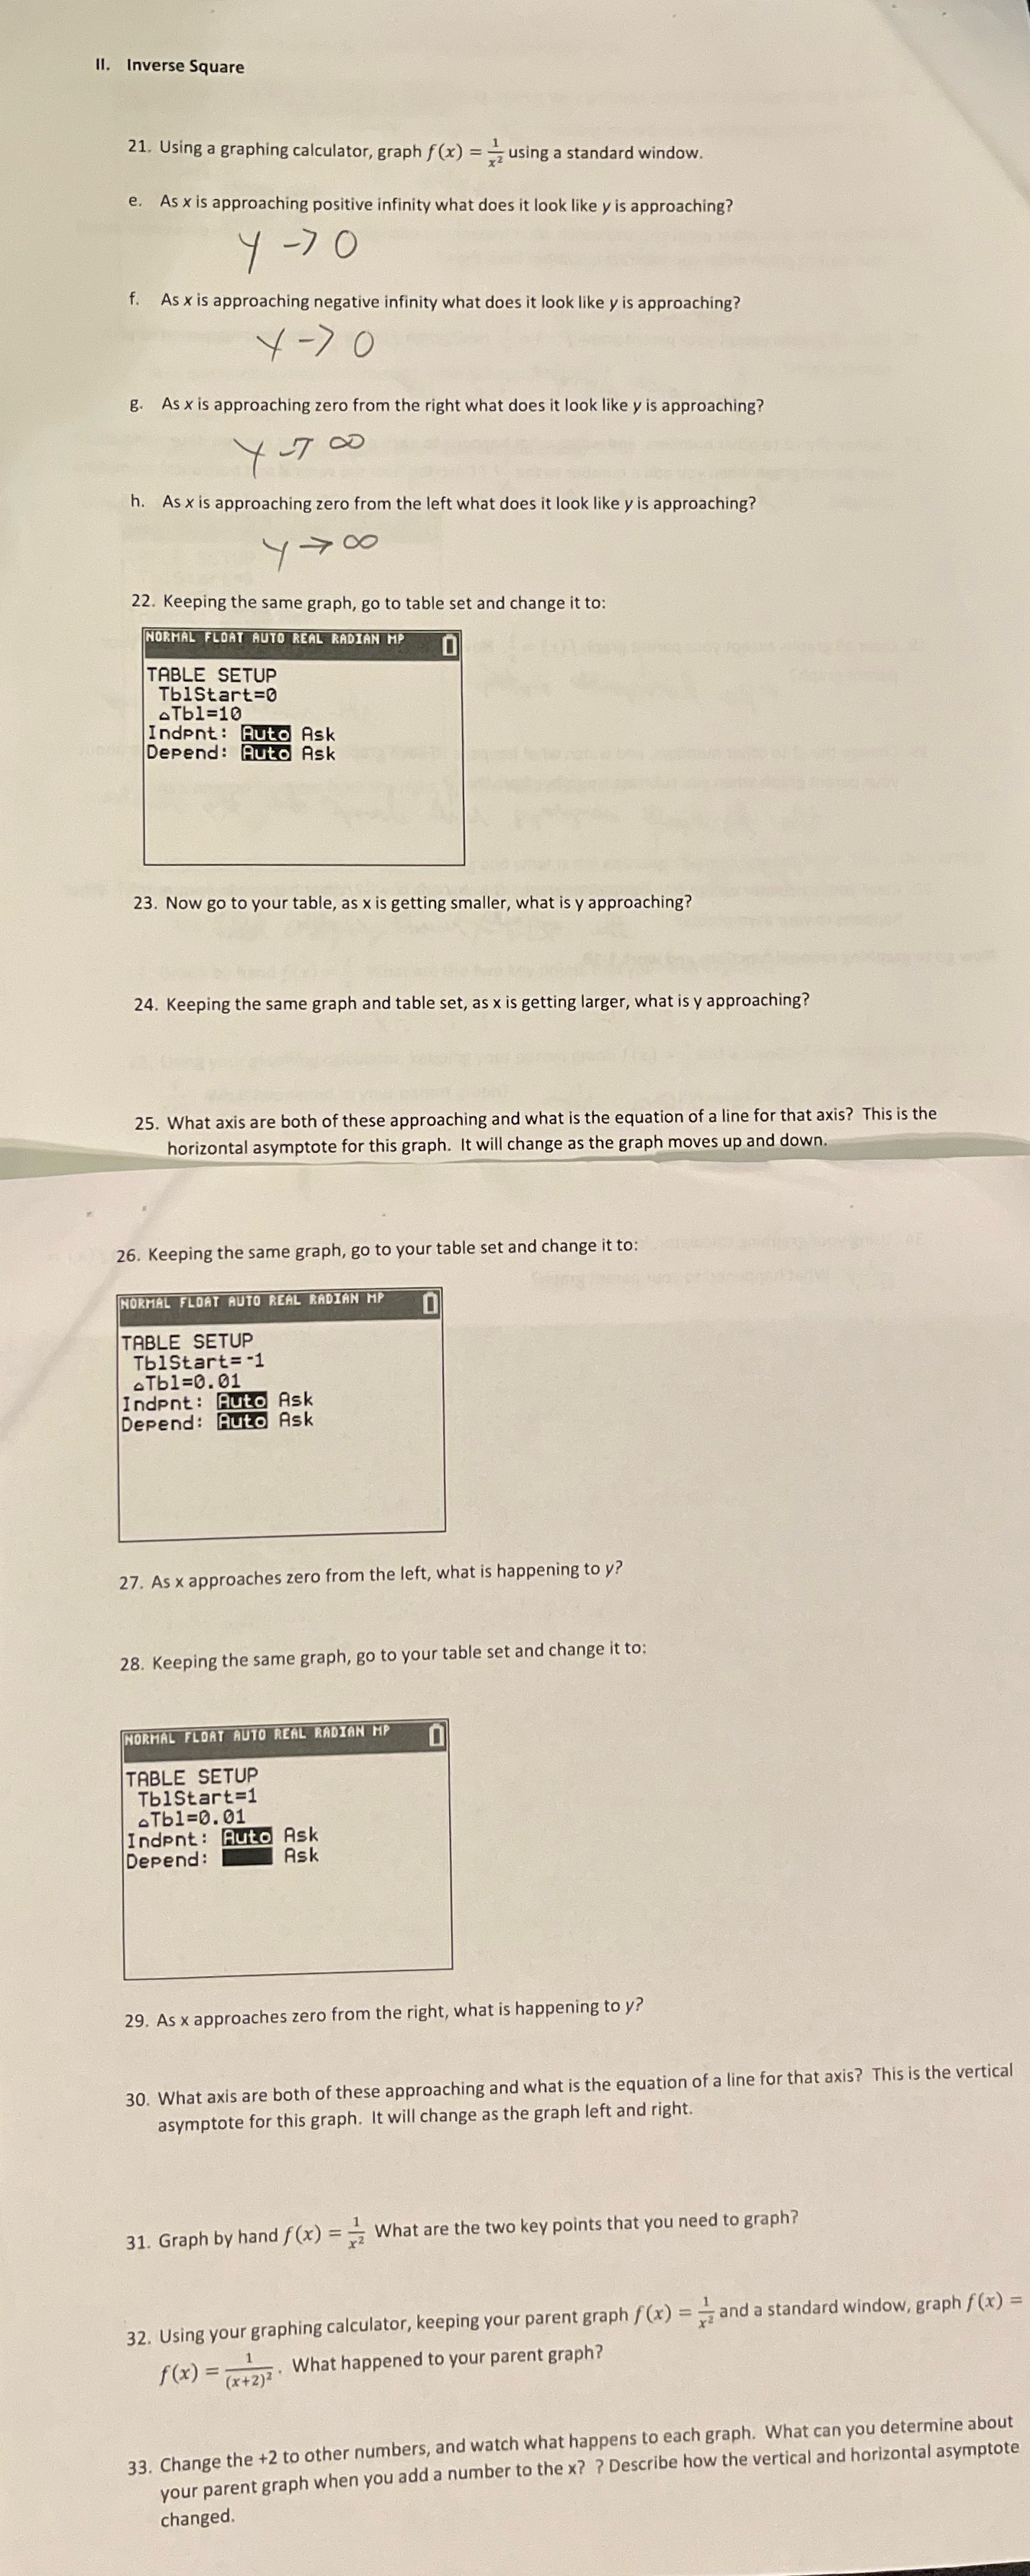
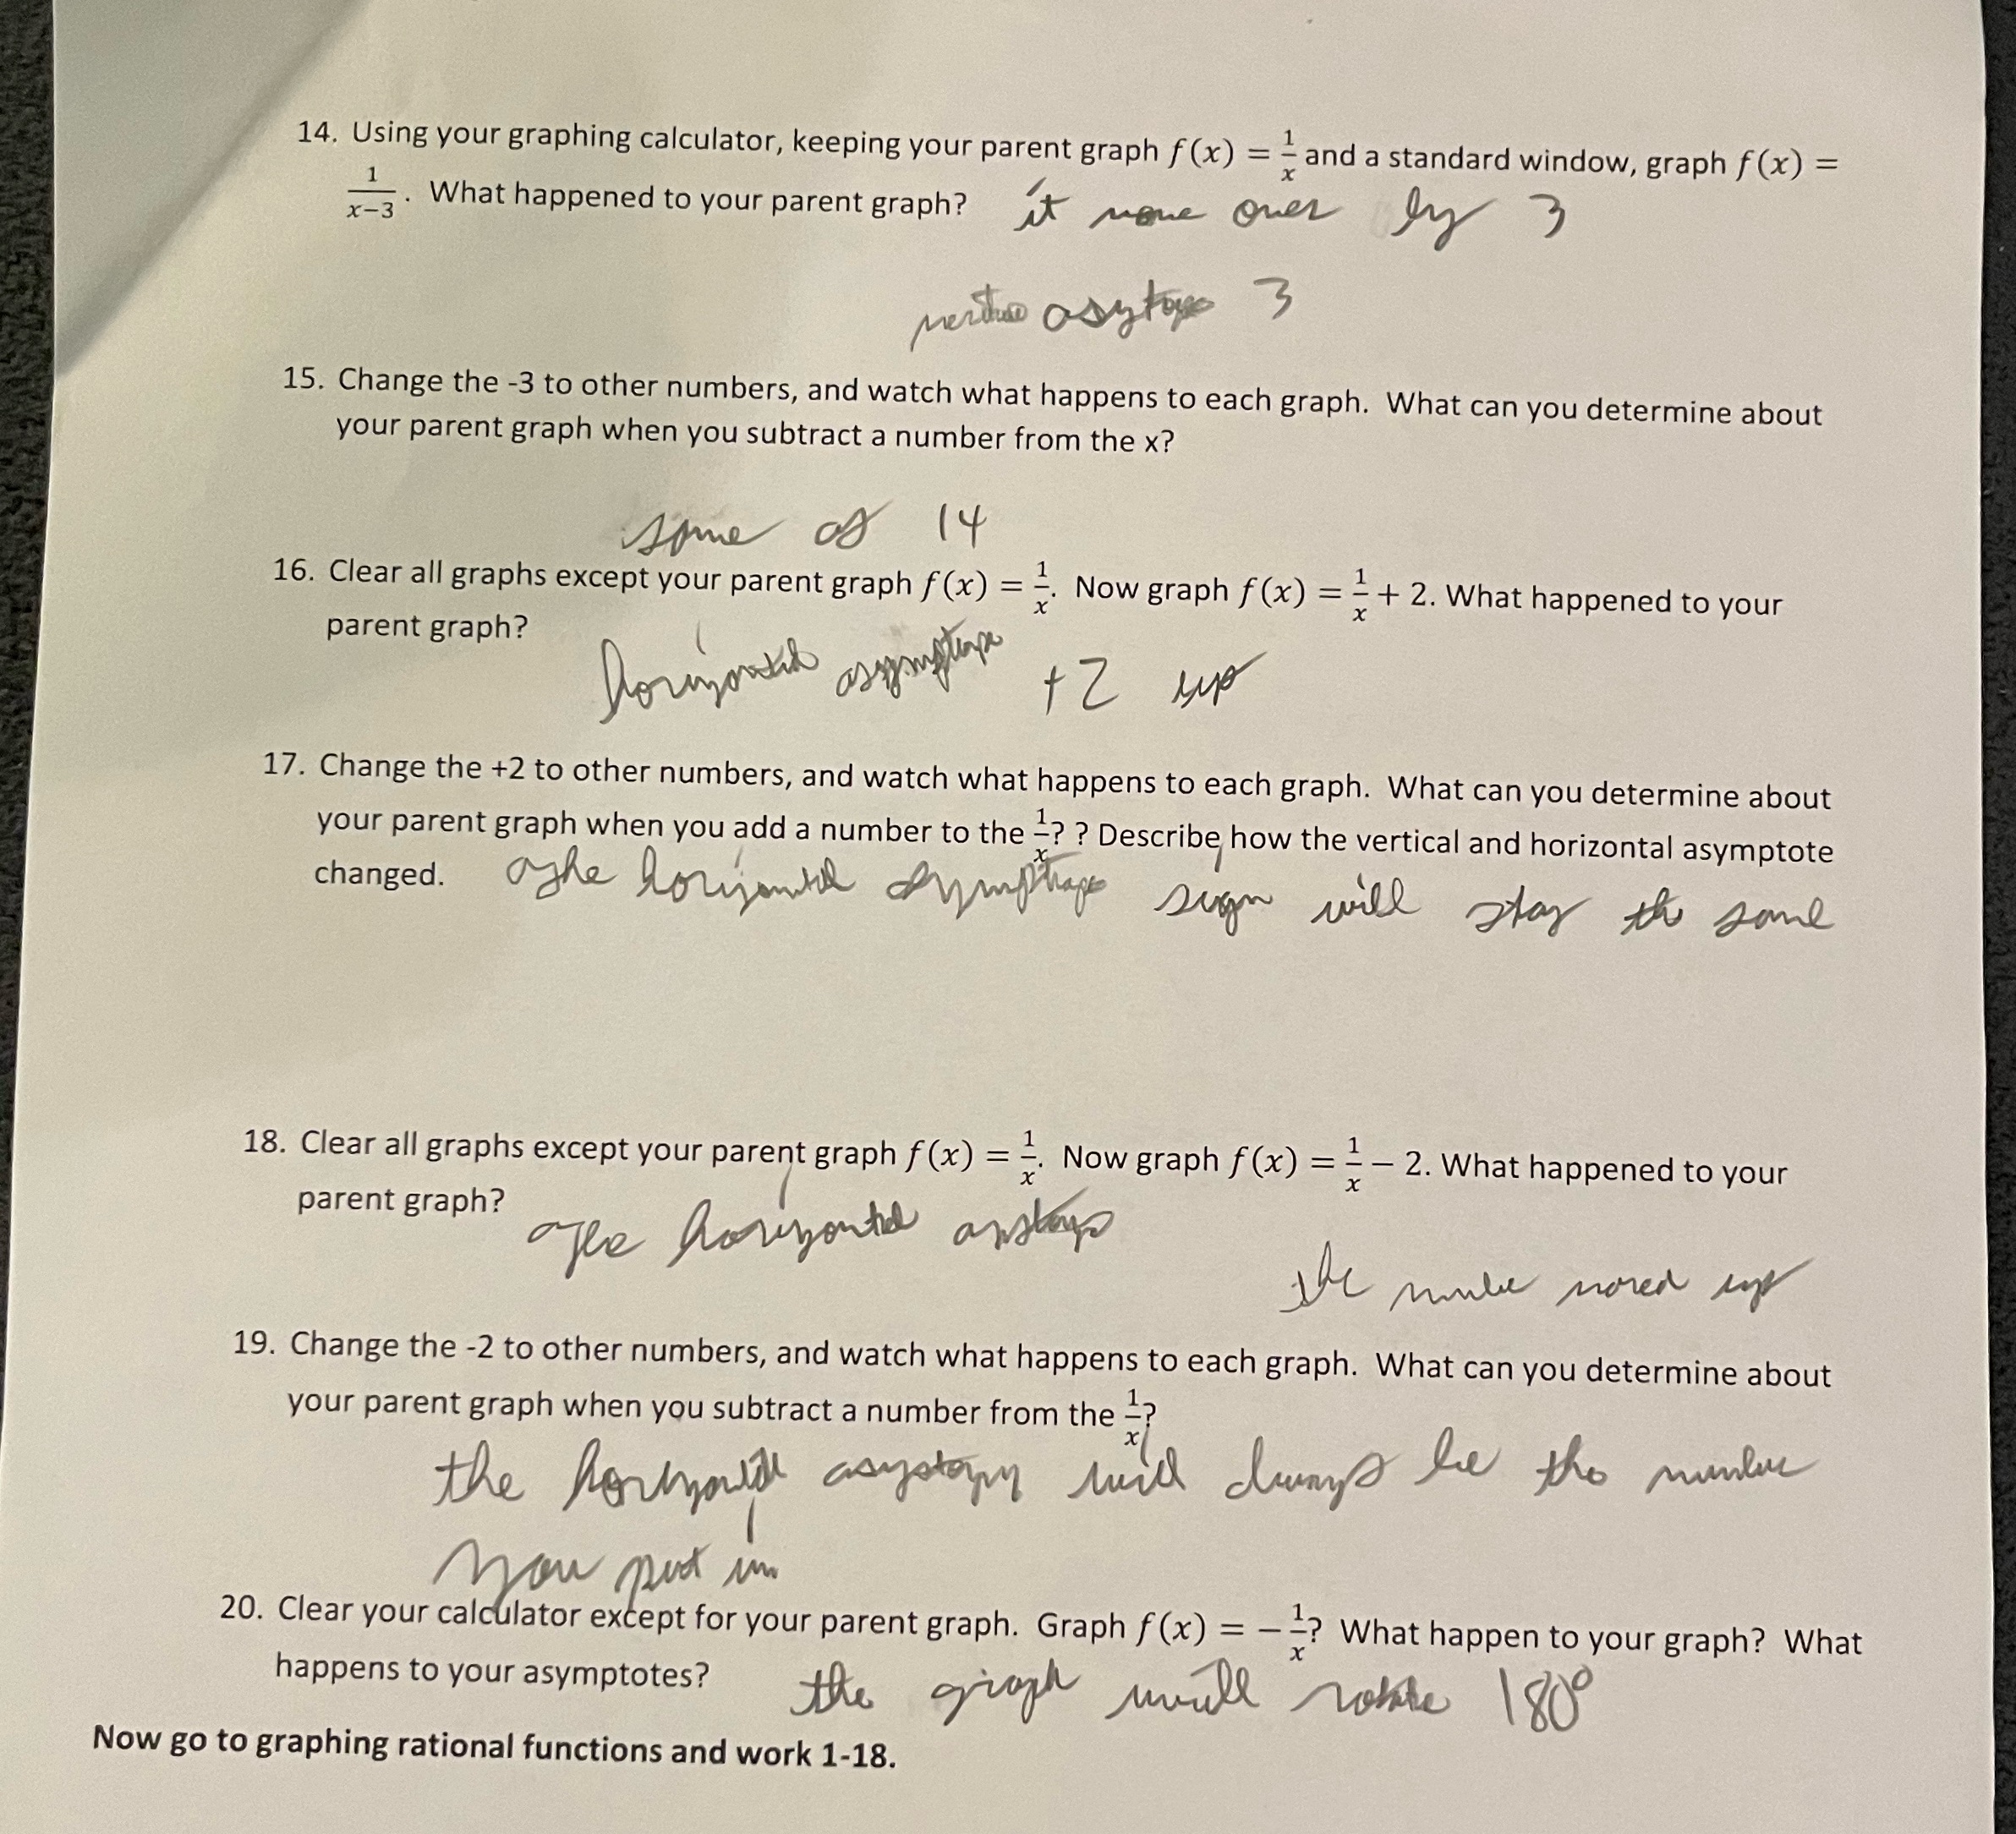
Il. Inverse Square 21. Using a graphing calculator, graph f (x) = => using a standard window. e. As x is approaching positive infinity what does it look like y is approaching? 4 - 70 f. As x is approaching negative infinity what does it look like y is approaching? 4 - 70 g. As x is approaching zero from the right what does it look like y is approaching? h. As x is approaching zero from the left what does it look like y is approaching? 22. Keeping the same graph, go to table set and change it to: NORMAL FLOAT AUTO REAL RADIAN MP TABLE SETUP TblStart=0 Tbl=10 Indent : Auto Ask Depend: Auto Ask 23. Now go to your table, as x is getting smaller, what is y approaching? 24. Keeping the same graph and table set, as x is getting larger, what is y approaching? 25. What axis are both of these approaching and what is the equation of a line for that axis? This is the horizontal asymptote for this graph. It will change as the graph moves up and down. 26. Keeping the same graph, go to your table set and change it to: NORMAL FLOAT AUTO REAL RADIAN MP TABLE SETUP TblStart= -1 Tbl=0. 01 Indent : Auto Ask Depend: Auto Ask 27. As x approaches zero from the left, what is happening to y? 28. Keeping the same graph, go to your table set and change it to: NORMAL FLOAT AUTO REAL RADIAN MP 0 TABLE SETUP TblStart=1 Tb1=0. 01 Indent: Auto Ask Depend: Ask 29. As x approaches zero from the right, what is happening to y? 30. What axis are both of these approaching and what is the equation of a line for that axis? This is the vertical asymptote for this graph. It will change as the graph left and right. 31. Graph by hand f(x) = What are the two key points that you need to graph? 32. Using your graphing calculator, keeping your parent graph f(x) = = and a standard window, graph f (x) = f(x) = (x+2)3 . What happened to your parent graph? 33. Change the +2 to other numbers, and watch what happens to each graph. What can you determine about your parent graph when you add a number to the x? ? Describe how the vertical and horizontal asymptote changed.14. Using your graphing calculator, keeping your parent graph f (x) = - and a standard window, graph f (x) = 3. What happened to your parent graph ? it move over by 3 15. Change the -3 to other numbers, and watch what happens to each graph. What can you determine about your parent graph when you subtract a number from the x? some of 14 16. Clear all graphs except your parent graph f (x) = -. Now graph f (x) = - + 2. What happened to your parent graph? 17. Change the +2 to other numbers, and watch what happens to each graph. What can you determine about your parent graph when you add a number to the ? ? Describe how the vertical and horizontal asymptote changed. the horizonte dryinghage sign will stay the same 18. Clear all graphs except your parent graph f (x) = 2. Now graph f (x) = = - 2. What happened to your parent graph? the rube moved up 19. Change the -2 to other numbers, and watch what happens to each graph. What can you determine about your parent graph when you subtract a number from the ? the forty asystory wind dumys te the mundur 20. Clear your calculator except for your parent graph. Graph f (x) = - ? What happen to your graph? What happens to your asymptotes? the graph will roble 180 Now go to graphing rational functions and work 1-18
Step by Step Solution
There are 3 Steps involved in it

Get step-by-step solutions from verified subject matter experts