

Question: How would you calculate mean, standard deviation and control limits as well as Plotting the coordinates on control chart. 4 August 2 0 1 9
How would you calculate mean, standard
deviation and control limits as well as
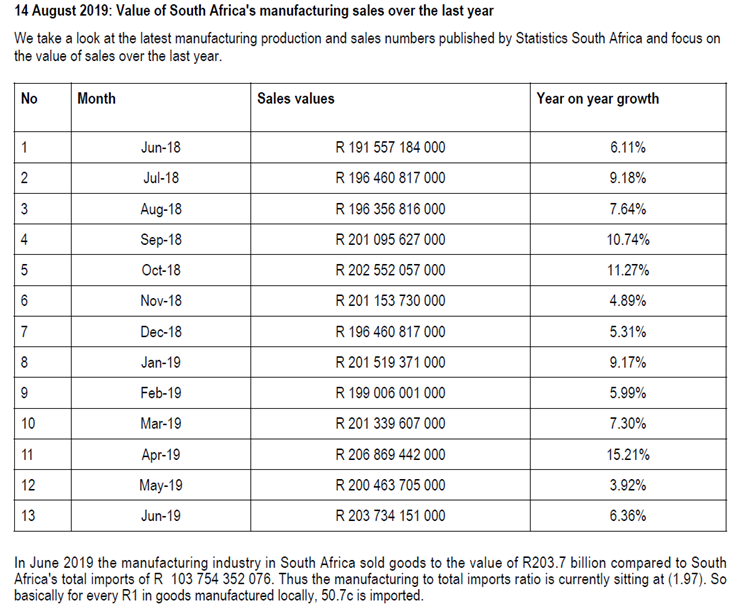
Plotting the coordinates on control chart. August : Value of South Africa's manufacturing sales over the last year
We take a look at the latest manufacturing production and sales numbers published by Statistics South Africa and focus on the value of sales over the last year.
tableNoMonth,Sales values,Year on year growthJunR
Step by Step Solution
There are 3 Steps involved in it
1 Expert Approved Answer
Step: 1 Unlock

Question Has Been Solved by an Expert!
Get step-by-step solutions from verified subject matter experts
Step: 2 Unlock
Step: 3 Unlock