

Question: How would you graph this for duration on excel? Duration Reno ruling Farm lElie nt's Name: Frank Date: May 18, 2021 {)bsenrer: Definition of Target
How would you graph this for duration on excel?
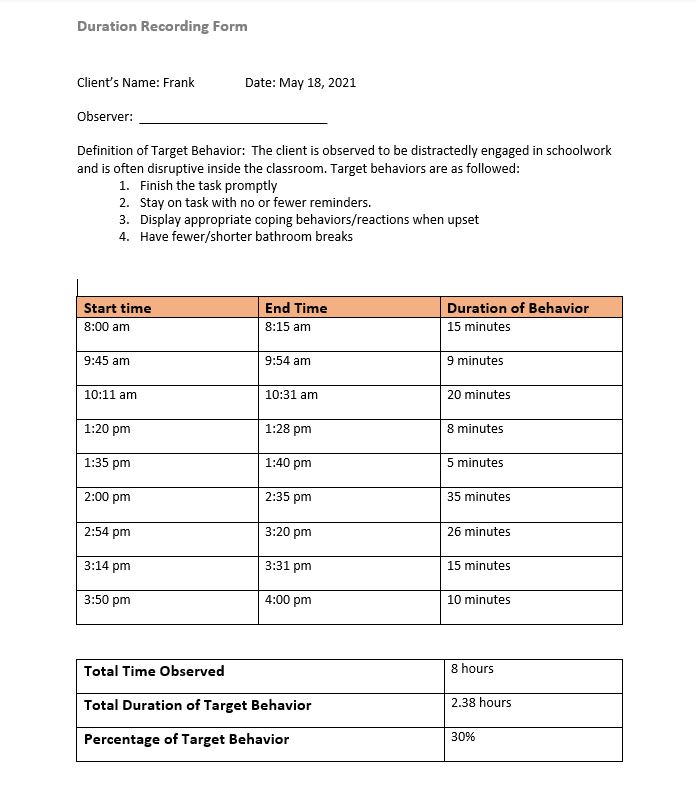
Duration Reno ruling Farm lElie nt's Name: Frank Date: May 18, 2021 {)bsenrer: Definition of Target Behavior: The client is obser to be Idistractedhur engaged in schoolwork and is often disruptive inside the classroom. Target behaviors are as followed: 1. Finish the task prompy 2. Stay on task with no or fewer reminders. 3. Display appropriate coping behaviorsfreactions when upset 4. Have fewerfshorter bathroom breaks 8:00 am i l I 8:15 am i l 15 minutes 9:45 am 9:54 am 9 minutes 10:11 am 10:31 am 20 minutes 1:20 pm 1:28 pm 8 minutes 1:35 pm 1:40 pm 5 minutes 2:00 pm 2:35 pm 35 minutes 2:54 pm 3:20 pm 25 minutes 3:14 pm 3:31 pm 15 minutes 3:50 pm 4:00 pm 10 minutes Total Time Observed 3 \"OUTS Total Duration of Target Behavior 2-33 hDUIS Percentage of Target Behavior 30%
Step by Step Solution
There are 3 Steps involved in it

Get step-by-step solutions from verified subject matter experts