

Question: How would you perform a sensitivity analysis on the unit sales, salvage value, and WACC for the project? Assume that each of these variables deviates
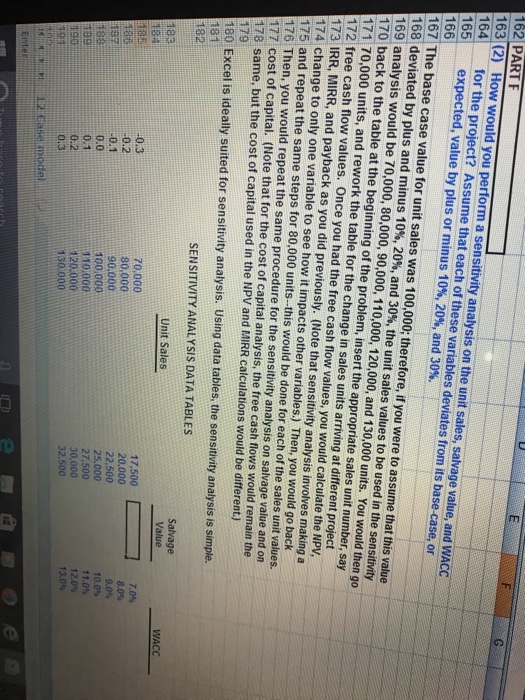
How would you perform a sensitivity analysis on the unit sales, salvage value, and WACC for the project? Assume that each of these variables deviates from its base case, or expected, value by plus or minus 10%, 20%, and 30%. The base case value for unit sales was 100,000; therefore, if you were to assume that this value deviated by plus and minus 10%, 20%, and 30%, the unit sales values to be used in the sensitivity analysis would be 70,000, 80,000, 90,000, 110,000, 120,000, and 130,000 units. You would then go back to the table at the beginning of the problem, insert the appropriate sales unit number, say 70,000 units, and rework the table for the changes in sales units arriving at different project free cash flow values, Once you had the free cash flow values, you would calculate the NPV, IRR, MIRR, and payback as you did previously. (Note that sensitivity analysis involves making a change to only one variable to see how it impacts other variables.) Then, you would go back and repeat the same steps for 80,000 units--this would be done for each of the sales unit values. Then, you would repeat the same procedure for the sensitivity analysis on salvage value and on cost of capital. (Note that for the cost of capital analysis, the free cash flows would remain the same, but the cost of capital used in the NPV and MIRR calculations would be different.) Excel is ideally suited for sensitivity analysis. Using data tables, the sensitivity analysis is simple
Step by Step Solution
There are 3 Steps involved in it

Get step-by-step solutions from verified subject matter experts