

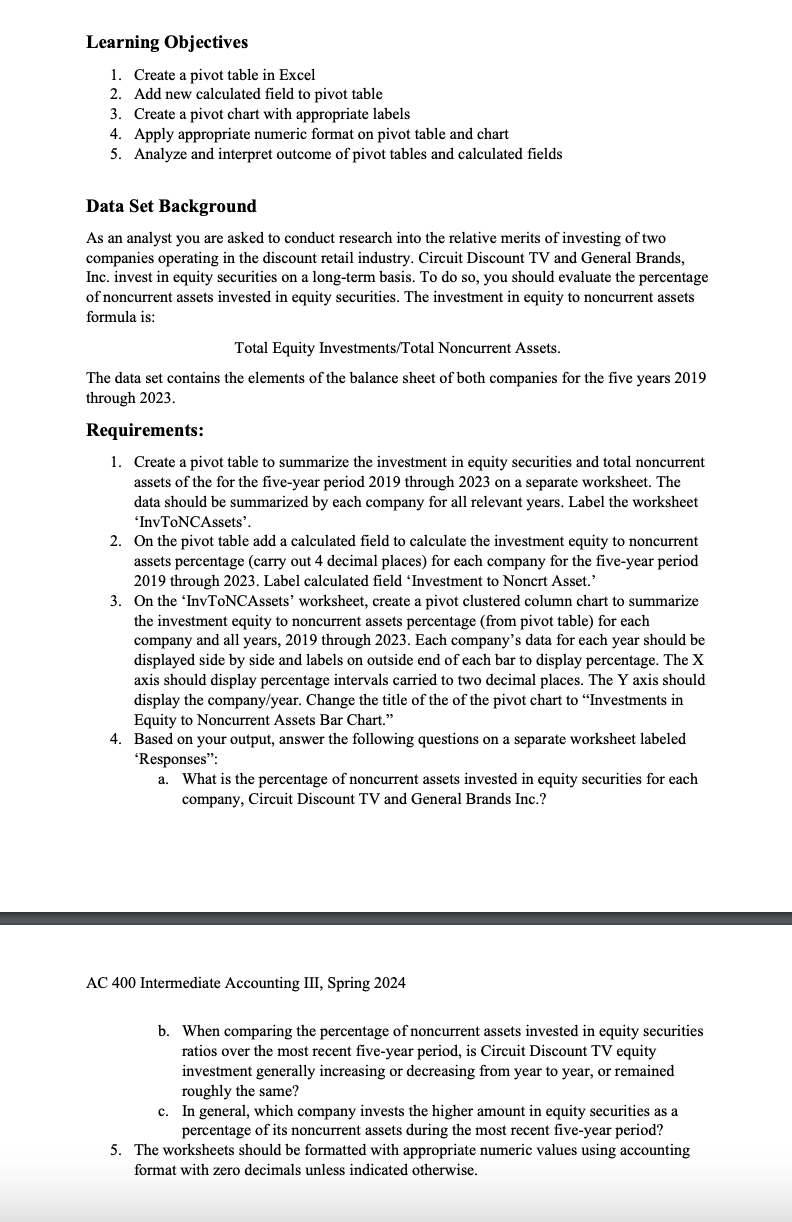
https://1drv.ms/x/c/326708d129127314/EVyprsfFjRFJq_sgdn8dvCYBuEWL68Axd7AkajKfgd4o6A Learning Objectives 1. Create a pivot table in Excel 2. Add new calculated field to pivot
Fantastic news! We've Found the answer you've been seeking!
Question:
https://1drv.ms/x/c/326708d129127314/EVyprsfFjRFJq_sgdn8dvCYBuEWL68Axd7AkajKfgd4o6A
Transcribed Image Text:
Learning Objectives 1. Create a pivot table in Excel 2. Add new calculated field to pivot table 3. Create a pivot chart with appropriate labels 4. Apply appropriate numeric format on pivot table and chart 5. Analyze and interpret outcome of pivot tables and calculated fields Data Set Background As an analyst you are asked to conduct research into the relative merits of investing of two companies operating in the discount retail industry. Circuit Discount TV and General Brands, Inc. invest in equity securities on a long-term basis. To do so, you should evaluate the percentage of noncurrent assets invested in equity securities. The investment in equity to noncurrent assets formula is: Total Equity Investments/Total Noncurrent Assets. The data set contains the elements of the balance sheet of both companies for the five years 2019 through 2023. Requirements: 1. Create a pivot table to summarize the investment in equity securities and total noncurrent assets of the for the five-year period 2019 through 2023 on a separate worksheet. The data should be summarized by each company for all relevant years. Label the worksheet 'InvToNCAssets'. 2. On the pivot table add a calculated field to calculate the investment equity to noncurrent assets percentage (carry out 4 decimal places) for each company for the five-year period 2019 through 2023. Label calculated field 'Investment to Noncrt Asset." 3. On the 'InvToNCAssets' worksheet, create a pivot clustered column chart to summarize the investment equity to noncurrent assets percentage (from pivot table) for each company and all years, 2019 through 2023. Each company's data for each year should be displayed side by side and labels on outside end of each bar to display percentage. The X axis should display percentage intervals carried to two decimal places. The Y axis should display the company/year. Change the title of the of the pivot chart to "Investments in Equity to Noncurrent Assets Bar Chart." 4. Based on your output, answer the following questions on a separate worksheet labeled *Responses": a. What is the percentage of noncurrent assets invested in equity securities for each company, Circuit Discount TV and General Brands Inc.? AC 400 Intermediate Accounting III, Spring 2024 b. When comparing the percentage of noncurrent assets invested in equity securities ratios over the most recent five-year period, is Circuit Discount TV equity investment generally increasing or decreasing from year to year, or remained roughly the same? c. In general, which company invests the higher amount in equity securities as a percentage of its noncurrent assets during the most recent five-year period? 5. The worksheets should be formatted with appropriate numeric values using accounting format with zero decimals unless indicated otherwise. Learning Objectives 1. Create a pivot table in Excel 2. Add new calculated field to pivot table 3. Create a pivot chart with appropriate labels 4. Apply appropriate numeric format on pivot table and chart 5. Analyze and interpret outcome of pivot tables and calculated fields Data Set Background As an analyst you are asked to conduct research into the relative merits of investing of two companies operating in the discount retail industry. Circuit Discount TV and General Brands, Inc. invest in equity securities on a long-term basis. To do so, you should evaluate the percentage of noncurrent assets invested in equity securities. The investment in equity to noncurrent assets formula is: Total Equity Investments/Total Noncurrent Assets. The data set contains the elements of the balance sheet of both companies for the five years 2019 through 2023. Requirements: 1. Create a pivot table to summarize the investment in equity securities and total noncurrent assets of the for the five-year period 2019 through 2023 on a separate worksheet. The data should be summarized by each company for all relevant years. Label the worksheet 'InvToNCAssets'. 2. On the pivot table add a calculated field to calculate the investment equity to noncurrent assets percentage (carry out 4 decimal places) for each company for the five-year period 2019 through 2023. Label calculated field 'Investment to Noncrt Asset." 3. On the 'InvToNCAssets' worksheet, create a pivot clustered column chart to summarize the investment equity to noncurrent assets percentage (from pivot table) for each company and all years, 2019 through 2023. Each company's data for each year should be displayed side by side and labels on outside end of each bar to display percentage. The X axis should display percentage intervals carried to two decimal places. The Y axis should display the company/year. Change the title of the of the pivot chart to "Investments in Equity to Noncurrent Assets Bar Chart." 4. Based on your output, answer the following questions on a separate worksheet labeled *Responses": a. What is the percentage of noncurrent assets invested in equity securities for each company, Circuit Discount TV and General Brands Inc.? AC 400 Intermediate Accounting III, Spring 2024 b. When comparing the percentage of noncurrent assets invested in equity securities ratios over the most recent five-year period, is Circuit Discount TV equity investment generally increasing or decreasing from year to year, or remained roughly the same? c. In general, which company invests the higher amount in equity securities as a percentage of its noncurrent assets during the most recent five-year period? 5. The worksheets should be formatted with appropriate numeric values using accounting format with zero decimals unless indicated otherwise.
Expert Answer:

Related Book For 
Introduction To Business Analytics
ISBN: 9781265454340
1st Edition
Authors: Vernon Richardson, Marcia Watson
Posted Date:
Students also viewed these accounting questions
-
In the Chapter 11 Data Analytics Case, you used Tableau to examine a data set and create calculations to compare the relative age of two companies assets. In this case you continue in your role as an...
-
Explain why merchants accepted gold receipts as a means of payment even though the receipts were issued by gold-smiths, not the government. What risk did goldsmiths introduce into the payments system...
-
On June 15, 2014, Malmo City authorizes the issuance of $500,000 par of 6 percent serial bonds to be issued on July 1, 2014, and to mature in annual serials of $100,000 beginning on July 1, 2015. The...
-
At the end of World War I, the Treaty of Versailles imposed an indemnity on Germany, a large annual payment from it to the victorious Allies. (Many historians believe this indemnity played a role in...
-
Respondents Varsity Brands, Inc., Varsity Spirit Corporation, and Varsity Spirit Fashions & Supplies, Inc., design, make, and sell cheerleading uniforms. Respondents have obtained or acquired more...
-
Rolanda Marshall Company, organized in 2007, has set up a single account for all intangible assets . The following summary discloses the debit entries that have been recorded during 2008. 1/2/08...
-
A firm just paid an annual dividend of $3.50 per share. Dividends are expected to grow at 5% per year. If the discount rate for this firm is 12%, how much is a share of this firm worth?Group of...
-
At 1228 K, Keq = 2.68 x 101 for the reaction NOCI(g) NO(g) + 1/2 Cl(g) What is the value of Keq for the following reaction at this same temperature? 2 NO(g) + Cl2(g) = 2 NOCI(g) a) For the second...
-
What are the 4 stages of the Carnot Cycle? Select four answers. Partial credit will be given for correct marks, and negative marks applied for incorrect answers. An overall score lower than zero...
-
1. Find vector c. Express this vector in any (reasonable) way you see fit. c = a + 3b = [3 m] + [-2 m]y b = [-1 m] + [4 m] 2. Find vector c. Express your answer in terms of magnitude and angle. c =...
-
3)The mathematical model of a dynamic system is defined by x" +4x' + 4x = 2e-t. a) Find the general solution of the homogeneous equation with initial conditions x(0) = = 1 and x'(0) = 0 b) Find a...
-
For the mechanism below, at the instant shown, the crank, AB, is rotating clockwise at 1.800 rpm and accelerating at 12.000 rad/s2. Use the relative acceleration method to determine the linear...
-
Vectors D and E are defined as: D= (10.2 i + 24.2 + -3.7 k) m E = (14.2 + -10.5 + 8.0 k) m Note that both of these are dislacement vectors and have units of meters (m). Find D. E. Value: 246.78 X...
-
The variable overhead efficiency variance: a. is interpreted in the same manner as the direct labor efficiency variance. b. measures the efficient use of factory utilities, factory maintenance, and...
-
Let (x) = x 2 - 9, g(x) = 2x, and h(x) = x - 3. Find each of the following. (((--) 2
-
The cost of a car battery is a major component of the cost of an electric car. Which confirmatory analytics techniques (including prescriptive analytics and predictive analytics) should a business...
-
Have you ever noticed that almost immediately after you search for something on the internet, you get a pop-up ad for a related item? Why do you think marketers use pop-up ads?
-
Which of the following collects data at remote points and transmits the data to monitoring equipment? a. Fill rate b. Operations dashboard c. Supply chain d. Telemetry
-
Use the numbers for the alcohol and tobacco category from the table in the Application "Goods with a Large Consumer Surplus Loss from Price Increases" to draw a figure that illustrates the roles that...
-
Change the answer given in the Challenge Solution for the short run rather than for the long run.
-
Are allocations \(a\) and \(g\) in Figure 10.4 part of the contract curve? Data From Figure 10.4:- 60 80 50 160 30 12. 20 20 Jane's wood 40 40 Denise's candy Od 20 Contract curve Denise's wood 20 218...

Study smarter with the SolutionInn App