

Question: https://apps.bea.gov/iTable/iTable.cfm?reqid=19&step=2#reqid=19&step=2&isuri=1&1921=survey This is the site for data USE SCTION1 - Domestic product and income table 1.1.1 and 1.1.6 Table 1.1.1: Please note that what is
https://apps.bea.gov/iTable/iTable.cfm?reqid=19&step=2#reqid=19&step=2&isuri=1&1921=survey
This is the site for data
USE SCTION1 - Domestic product and income table 1.1.1 and 1.1.6
Table 1.1.1: Please note that what is shown in the table is the percent change from the previous quarter. For example, this picture shows that Personal Consumption Expenditures increased by 1.8% between the 2rd and 4th quarters of 2019. You do not need to do any calculations.
Table 1.1.6. The data shown is for RGDP and is reported in billions of dollars. For example, in Q4 2018 RGDP was $18,783.5 billion dollars or about $18.8 Trillion.
Part II: Record the Data
Use information from tables 1.1.1 and 1.1.6 on the BEA website to fill in this table and answer the questions below. What is shown in the image above may not be current. For your assignment please use the most recent two quarters shown on the website.
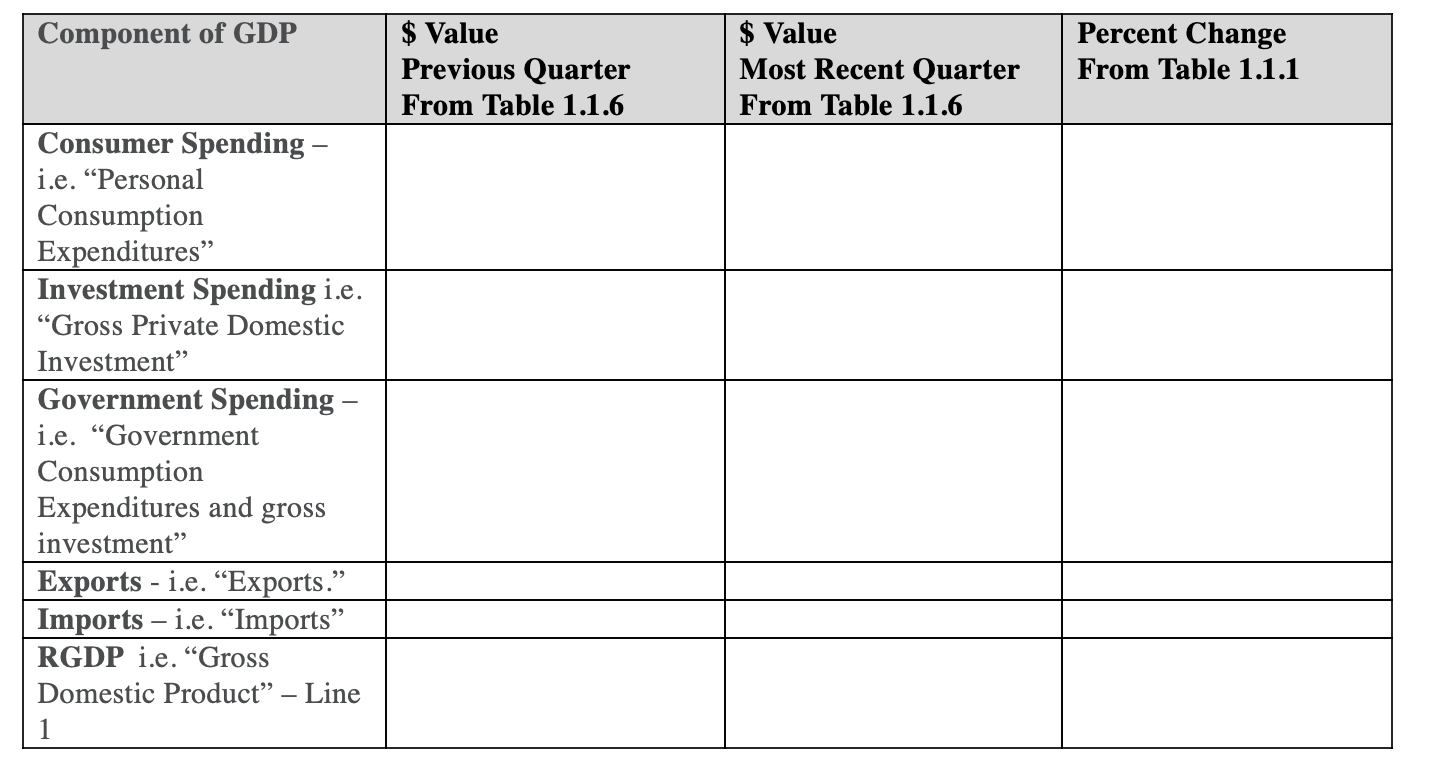
Component of GDP $ Value $ Value Percent Change Previous Quarter Most Recent Quarter From Table 1.1.1 From Table 1.1.6 From Table 1.1.6 Consumer Spending i.e. \"Personal Consumption Expenditures\" Investment Spending i.e. \"Gross Private Domestic Investment\" Government Spending i.e. \"Government Consumption Expenditures and gross investment\" RGDP i.e. \"Gross Domestic Product\" Line 1 \f
Step by Step Solution
There are 3 Steps involved in it

Get step-by-step solutions from verified subject matter experts