

Question: https://cran.r-project.org/web/packages/xgboost/xgboost.pdf This is SHAP contribution dependence plot from Xgboost classificatio. I have a hard time understanding it. xgb.plot.shap SHAP contribution dependency plots 1 CN 8
https://cran.r-project.org/web/packages/xgboost/xgboost.pdf
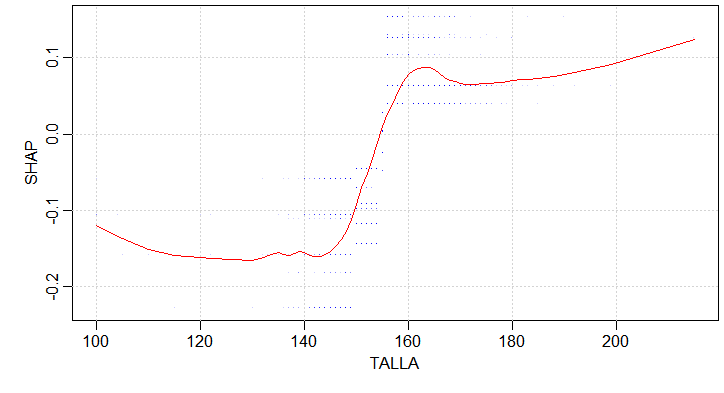
This is SHAP contribution dependence plot from Xgboost classificatio. I have a hard time understanding it.
xgb.plot.shap SHAP contribution dependency plots
1 CN 8 3 100 1e0) TALLA 120 140 180 200 1 CN 8 3 100 1e0) TALLA 120 140 180 200
Step by Step Solution
There are 3 Steps involved in it
1 Expert Approved Answer
Step: 1 Unlock

Question Has Been Solved by an Expert!
Get step-by-step solutions from verified subject matter experts
Step: 2 Unlock
Step: 3 Unlock