

Question: https://docs.google.com/spreadsheets/d/1wqULp1ELg_2uvVu5w_Djwmw7kPTCijGAqGQjvhCSHJM/edit Question 2 ata Lab problems should be done in StatCrunch. Do not do calculations by hand unless you are told to o so or
https://docs.google.com/spreadsheets/d/1wqULp1ELg_2uvVu5w_Djwmw7kPTCijGAqGQjvhCSHJM/edit
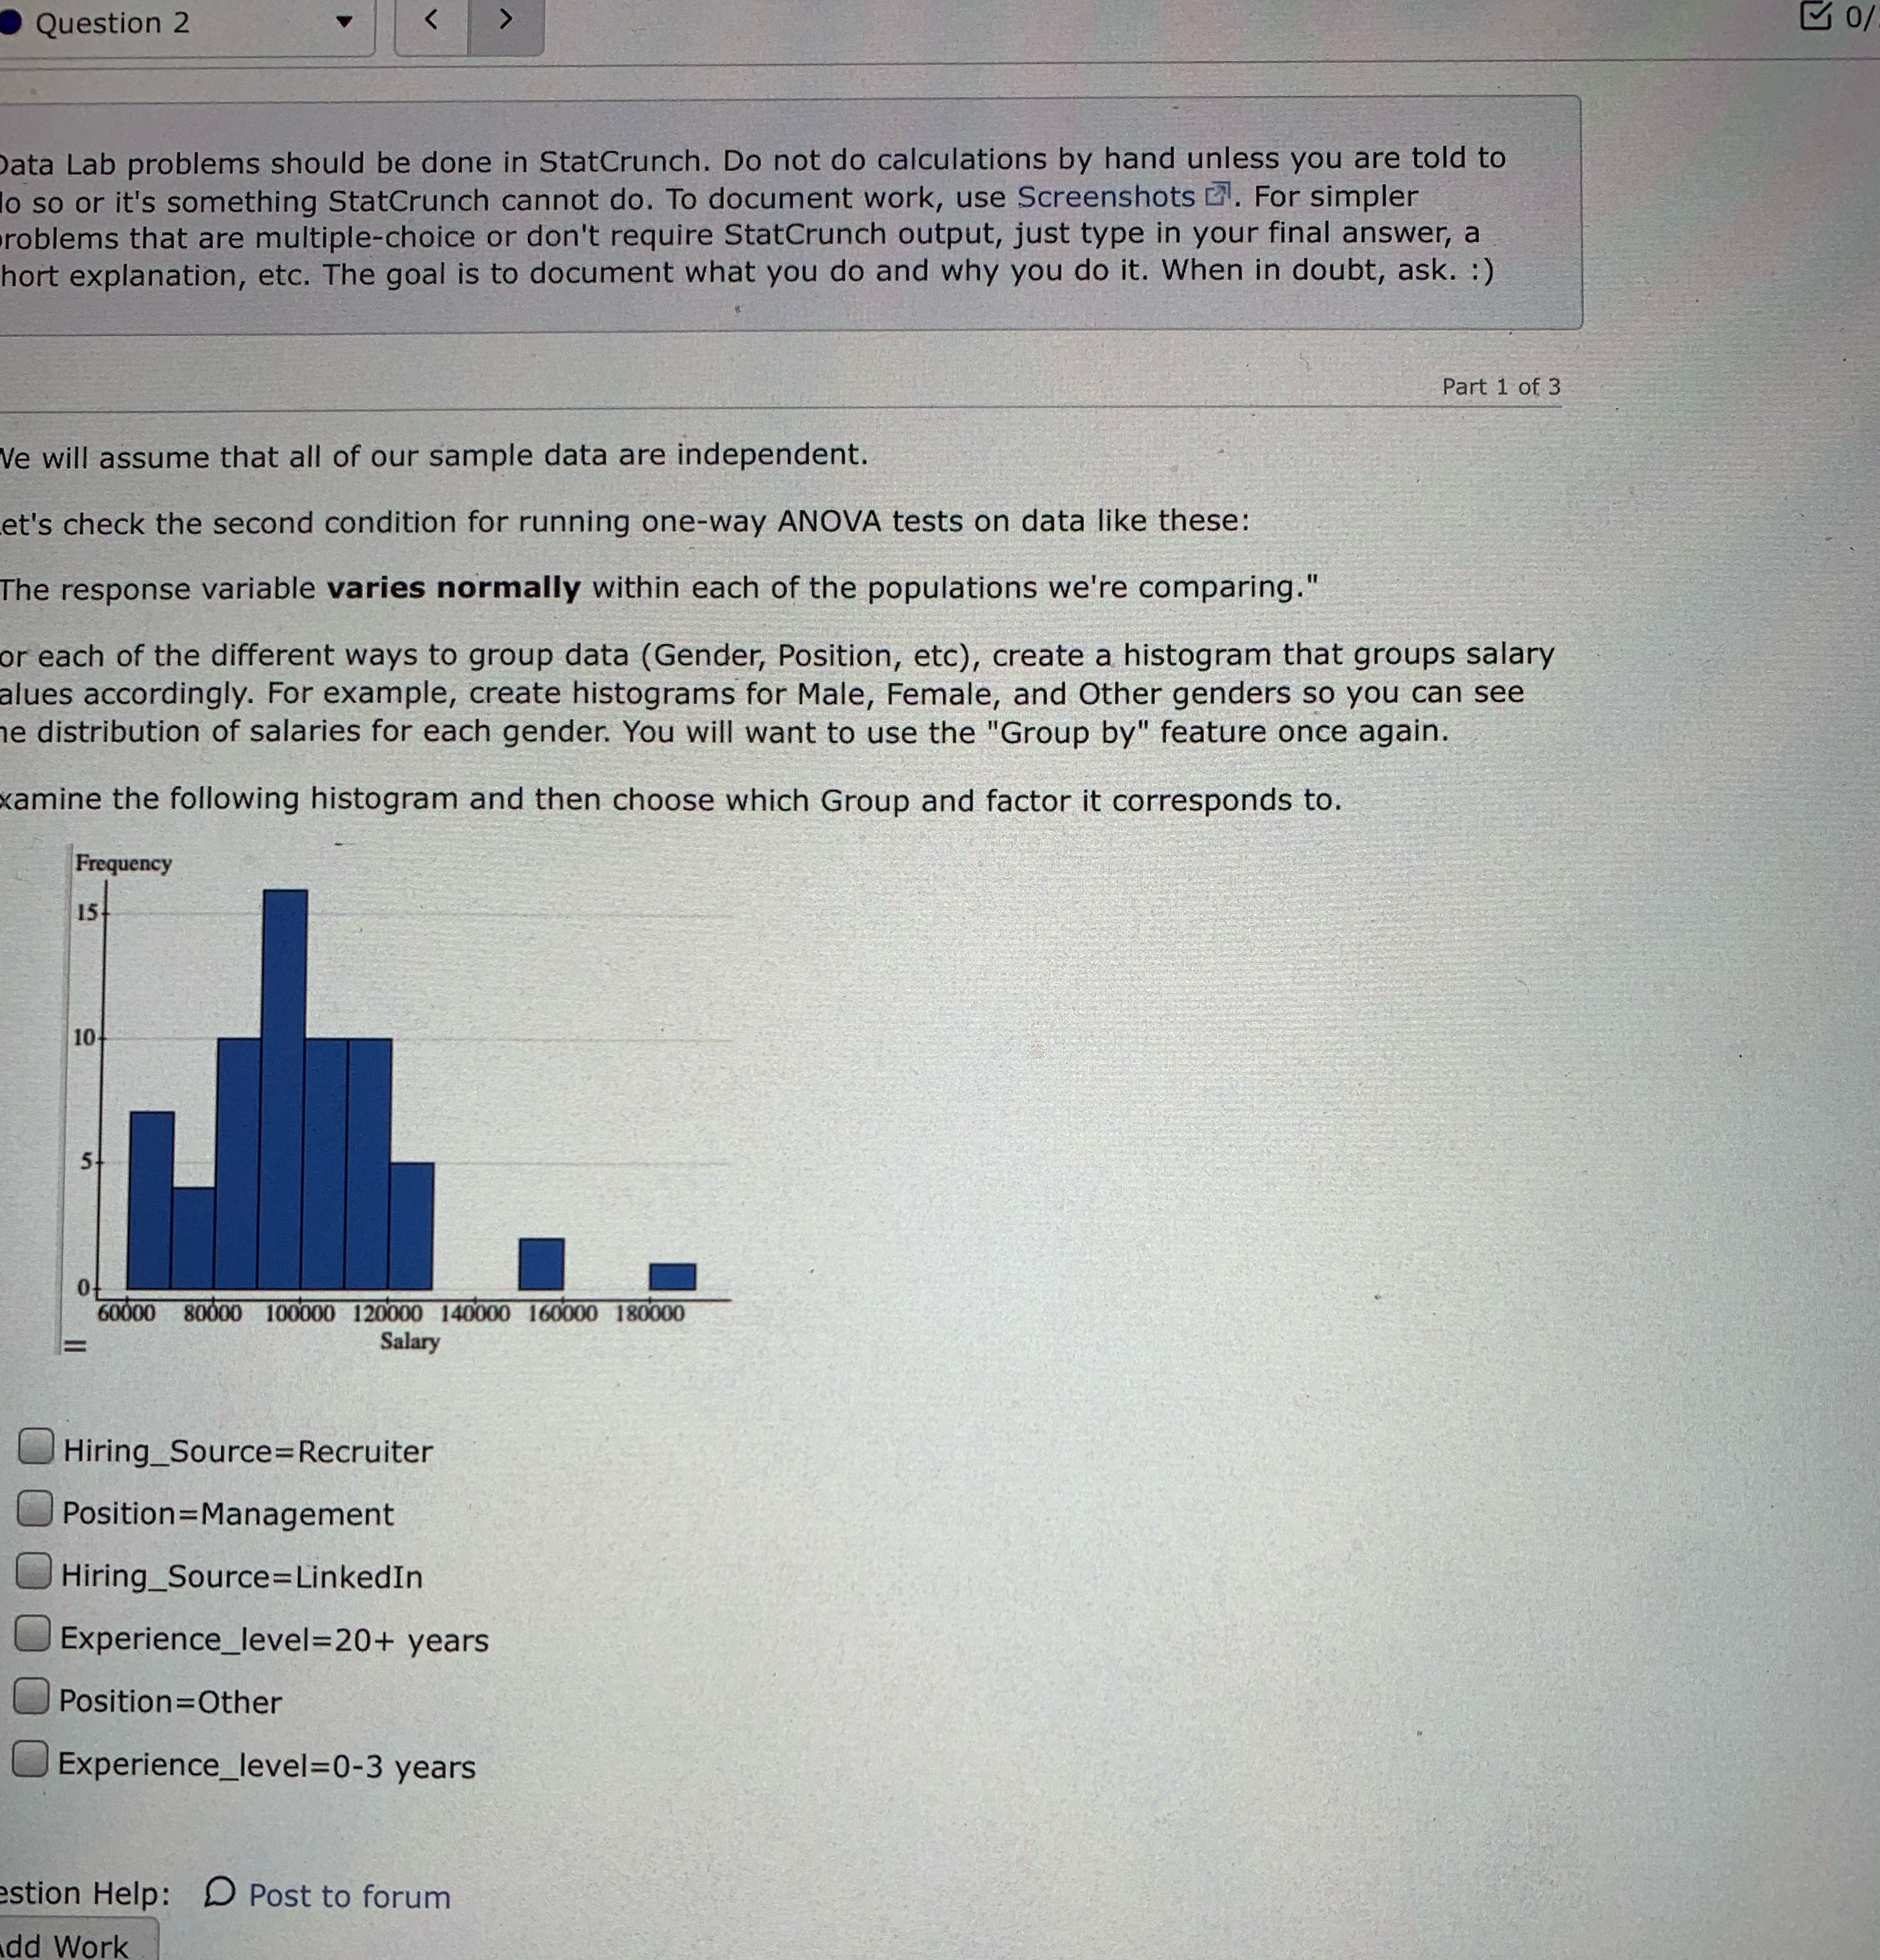
Question 2 ata Lab problems should be done in StatCrunch. Do not do calculations by hand unless you are told to o so or it's something StatCrunch cannot do. To document work, use Screenshots . For simpler roblems that are multiple-choice or don't require StatCrunch output, just type in your final answer, a ort explanation, etc. The goal is to document what you do and why you do it. When in doubt, ask. :) Part 1 of 3 Ve will assume that all of our sample data are independent. et's check the second condition for running one-way ANOVA tests on data like these: The response variable varies normally within each of the populations we're comparing." or each of the different ways to group data (Gender, Position, etc), create a histogram that groups salary alues accordingly. For example, create histograms for Male, Female, and Other genders so you can see e distribution of salaries for each gender. You will want to use the "Group by" feature once again. kamine the following histogram and then choose which Group and factor it corresponds to. Frequency 15 10 5 60000 80000 100000 120000 140000 160000 180000 Salary Hiring_Source=Recruiter Position=Management Hiring_Source=LinkedIn Experience_level=20+ years Position=Other Experience_level=0-3 years stion Help: D Post to forum dd Work
Step by Step Solution
There are 3 Steps involved in it

Get step-by-step solutions from verified subject matter experts