

Question: https://drive.google.com/drive/folders/1-0vAauUKLg-njx3WlnY3Kooj-0D_VwC8?? Problems 1 and 2 use the ice cream data set, the template for r studio is in the driveUse the T distribution for all
https://drive.google.com/drive/folders/1-0vAauUKLg-njx3WlnY3Kooj-0D_VwC8?? Problems 1 and 2 use the ice cream data set, the template for r studio is in the driveUse the T distribution for all problems involving means, even if the sample size is large.? Make sure to interpret all confidence intervals in the context of the problem.
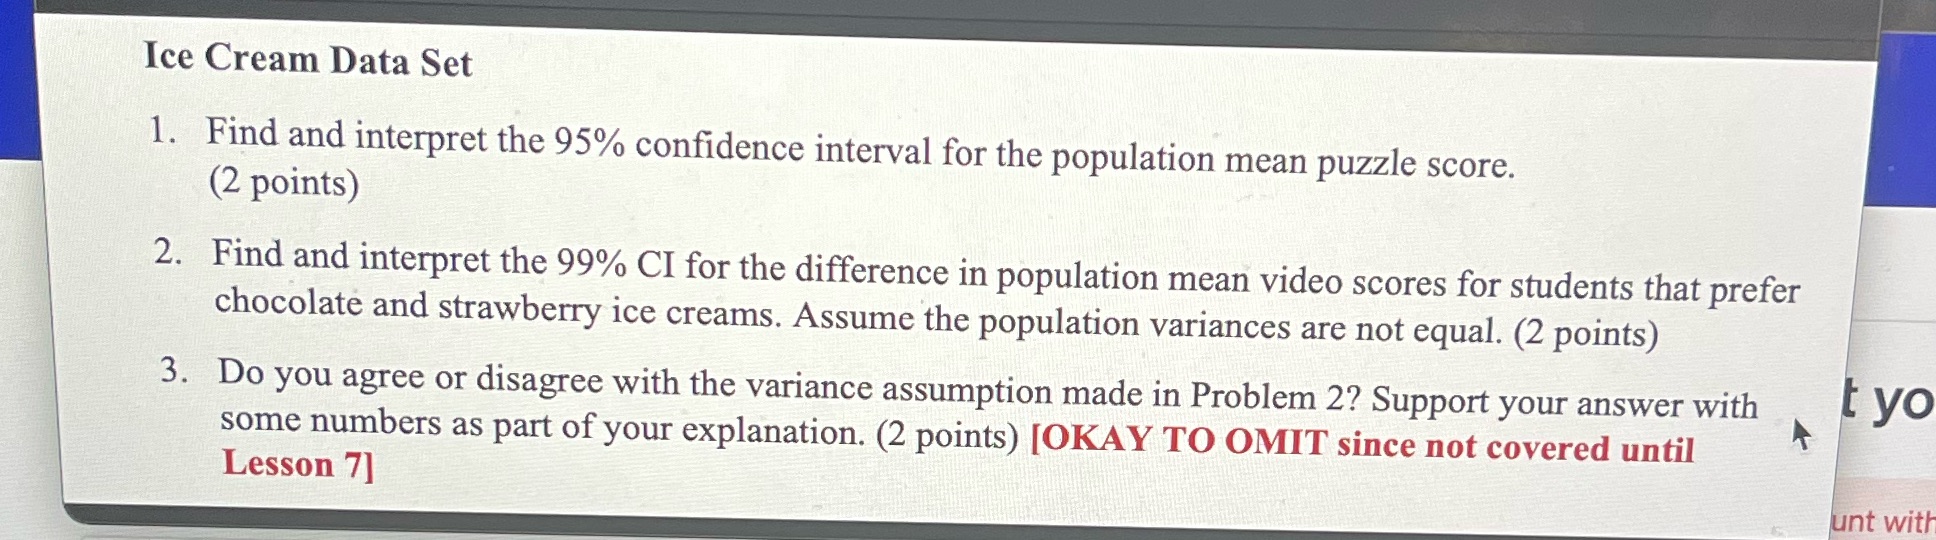
Ice Cream Data Set (2 points) 2. Find and interpret the 99% chocolate and strawberry i CI for the difference in population mean video scores for students that prefer ce creams. Assume the population variances are not equal. (2 points) 3. Do you agree or disagree with the variance assumption made in Problem 2? Support your answer with some numbers as part of your explanation. (2 points) [OKAY TO OMIT since not covered until Lesson 7] 't :yo fit with
Step by Step Solution
There are 3 Steps involved in it

Get step-by-step solutions from verified subject matter experts